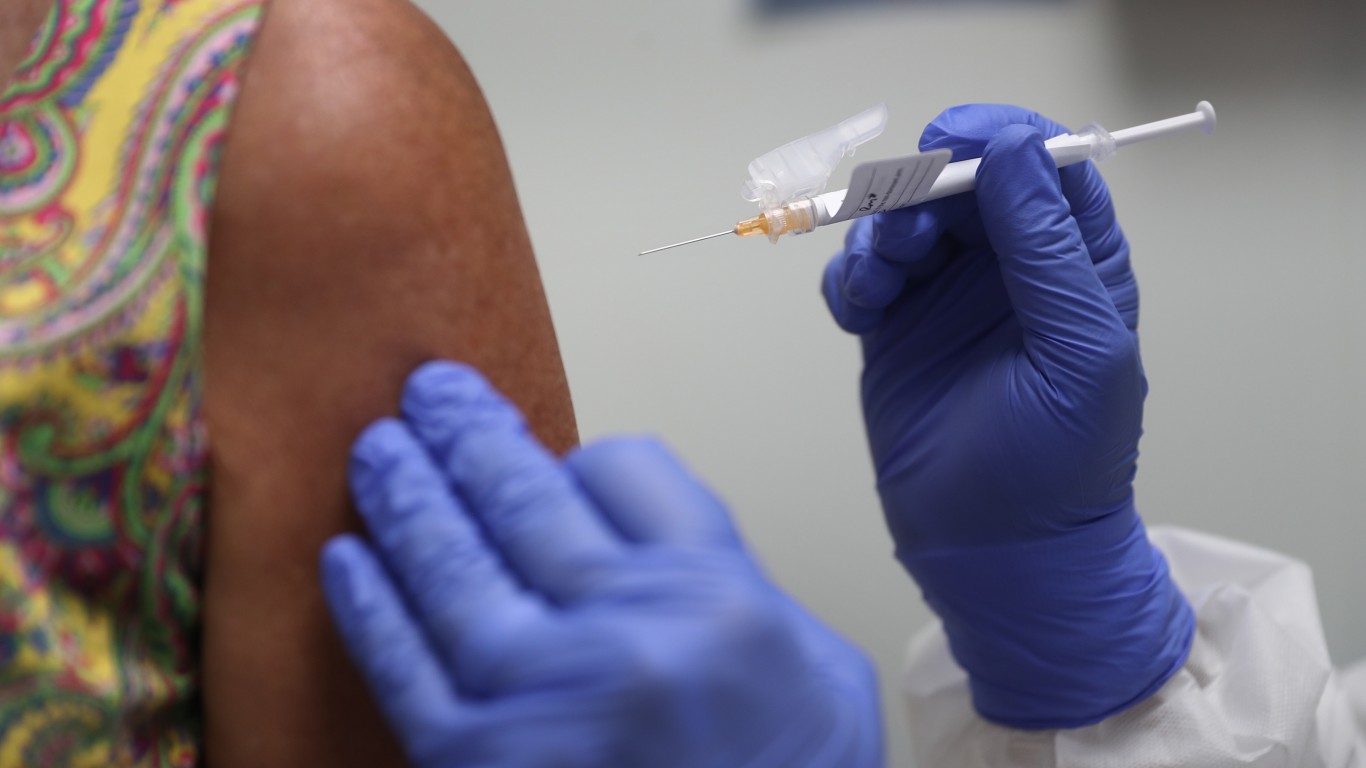

The rapidly spreading delta variant is fueling a surge in new cases of COVID-19 and adding urgency to the vaccination effort. So far, an estimated 179,289,983 Americans have been fully vaccinated, or 54.8% of the U.S. population.
Some states are proving more effective than others in getting their residents vaccinated. In New York, 61.6% of the population are fully vaccinated, higher than the U.S. average.
Though New York is doing a better job vaccinating its population than other states, there are still significant quantities of the vaccine sitting idle. As of Sept. 14, New York has received about 28,457,000 vaccinations and administered about 88.2% of those doses.
Meanwhile, the virus continues to spread. In total, there have been 2,336,640 confirmed cases of the virus in New York as of Sept. 14 — or 11,957 for every 100,000 people. For context, there have been 12,472 known infections for every 100,000 people nationwide.
All COVID-19 and vaccination data used in this story are current as of Sept. 14, 2021.
| Rank | Place | Share of pop. fully vaccinated | Fully vaccinated residents | Total COVID-19 cases per 100k people |
|---|---|---|---|---|
| 1 | Vermont | 68.4% | 428,656 | 4,397 |
| 2 | Maine | 67.3% | 900,614 | 6,015 |
| 3 | Connecticut | 67.1% | 2,398,333 | 10,606 |
| 4 | Massachusetts | 66.8% | 4,611,446 | 11,258 |
| 5 | Rhode Island | 66.4% | 701,682 | 15,686 |
| 6 | Maryland | 62.8% | 3,794,876 | 8,449 |
| 7 | New Jersey | 62.7% | 5,587,002 | 12,544 |
| 8 | Washington | 62.4% | 4,698,544 | 7,932 |
| 9 | New York | 61.6% | 12,032,960 | 11,957 |
| 10 | New Mexico | 61.5% | 1,288,968 | 11,448 |
| 11 | New Hampshire | 60.8% | 824,795 | 8,191 |
| 12 | Washington D.C. | 60.5% | 414,386 | 8,322 |
| 13 | Oregon | 59.7% | 2,501,336 | 7,083 |
| 14 | Virginia | 58.8% | 5,006,507 | 9,461 |
| 15 | Colorado | 58.8% | 3,346,895 | 11,147 |
| 16 | Minnesota | 57.3% | 3,217,321 | 11,878 |
| 17 | California | 57.2% | 22,640,451 | 11,497 |
| 18 | Delaware | 56.9% | 550,091 | 12,935 |
| 19 | Pennsylvania | 56.4% | 7,226,149 | 10,522 |
| 20 | Hawaii | 56.3% | 799,729 | 4,902 |
| 21 | Florida | 55.7% | 11,872,566 | 16,161 |
| 22 | Wisconsin | 55.2% | 3,209,820 | 12,969 |
| 23 | Nebraska | 53.5% | 1,032,416 | 13,118 |
| 24 | Iowa | 52.8% | 1,667,428 | 13,344 |
| 25 | Illinois | 52.0% | 6,627,684 | 12,278 |
| 26 | Michigan | 51.2% | 5,119,223 | 10,886 |
| 27 | Arizona | 50.6% | 3,626,908 | 14,621 |
| 28 | South Dakota | 50.5% | 445,130 | 15,503 |
| 29 | Kentucky | 50.2% | 2,243,979 | 13,883 |
| 30 | Nevada | 50.0% | 1,518,436 | 13,245 |
| 31 | Texas | 49.7% | 14,278,607 | 13,257 |
| 32 | Kansas | 49.7% | 1,447,023 | 13,297 |
| 33 | Utah | 49.6% | 1,567,519 | 15,184 |
| 34 | Ohio | 49.3% | 5,765,330 | 11,109 |
| 35 | North Carolina | 48.5% | 5,038,028 | 12,322 |
| 36 | Alaska | 48.1% | 354,618 | 12,333 |
| 37 | Montana | 47.5% | 504,921 | 12,587 |
| 38 | Indiana | 47.5% | 3,177,308 | 13,447 |
| 39 | Missouri | 46.6% | 2,853,498 | 12,845 |
| 40 | Oklahoma | 45.9% | 1,808,630 | 14,715 |
| 41 | South Carolina | 45.7% | 2,325,482 | 15,415 |
| 42 | Tennessee | 43.9% | 2,974,562 | 16,613 |
| 43 | Arkansas | 43.9% | 1,323,456 | 15,761 |
| 44 | Louisiana | 43.3% | 2,019,965 | 15,291 |
| 45 | Georgia | 43.2% | 4,544,963 | 14,110 |
| 46 | North Dakota | 42.9% | 325,756 | 16,125 |
| 47 | Mississippi | 41.2% | 1,229,562 | 15,413 |
| 48 | Idaho | 41.0% | 719,766 | 13,334 |
| 49 | Alabama | 40.5% | 1,980,807 | 15,350 |
| 50 | Wyoming | 40.2% | 232,414 | 13,958 |
| 51 | West Virginia | 39.7% | 716,327 | 11,645 |
Take This Retirement Quiz To Get Matched With A Financial Advisor (Sponsored)
Take the quiz below to get matched with a financial advisor today.
Each advisor has been vetted by SmartAsset and is held to a fiduciary standard to act in your best interests.
Here’s how it works:
1. Answer SmartAsset advisor match quiz
2. Review your pre-screened matches at your leisure. Check out the
advisors’ profiles.
3. Speak with advisors at no cost to you. Have an introductory call on the phone or introduction in person and choose whom to work with in the future
Take the retirement quiz right here.
Thank you for reading! Have some feedback for us?
Contact the 24/7 Wall St. editorial team.


