
It’s no secret that many Americans are forgoing homeownership in favor of renting. In 2020, renters in the U.S. occupied 43 million housing units.
The Stacker team looked at data from a United States Census survey that revealed an estimated 43,378,800 renter-occupied homes in the United States as of 2017, which makes up 36.1% of all households in the country. In 2019, renting was more affordable than buying a median-priced home in 59% of the counties; in 2021, the opposite was true: Owning was more affordable than renting in 63% of U.S. counties.
Stacker compiled a list of counties in Mississippi where people spend the highest percent of income on rent using data from the U.S. Census Bureau. Of course, saving money by owning a home is unattainable for many Americans who don’t have savings that could cover a down payment, those who are denied a mortgage, or both. Keep reading to see where in your home state most of people’s take-home pay goes to their monthly rent.
You may also like: Most popular girl names in the 80s in Mississippi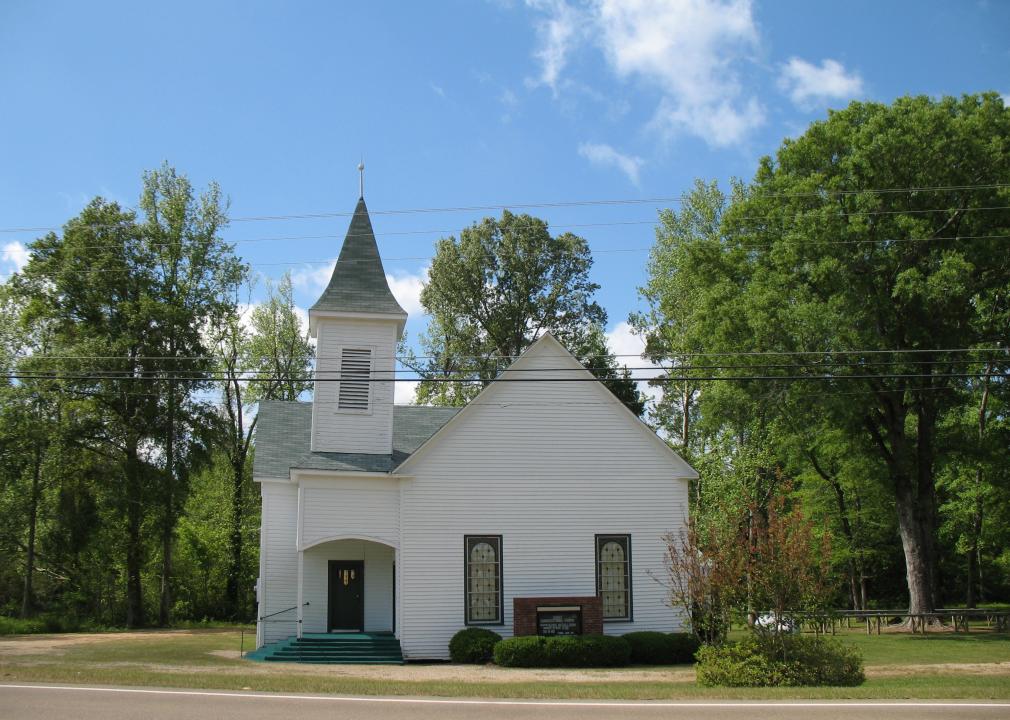
NatalieMaynor // Wikimedia Commons
#50. Rankin County
– Median percent of income spent on housing: 17.2%
— Percent of households spending <20% of income on housing: 58.3%
— Percent of households spending >30% of income on housing: 19.0%
– Total occupied households: 55,909
– Median household income: $65,996
– Median monthly housing cost: $945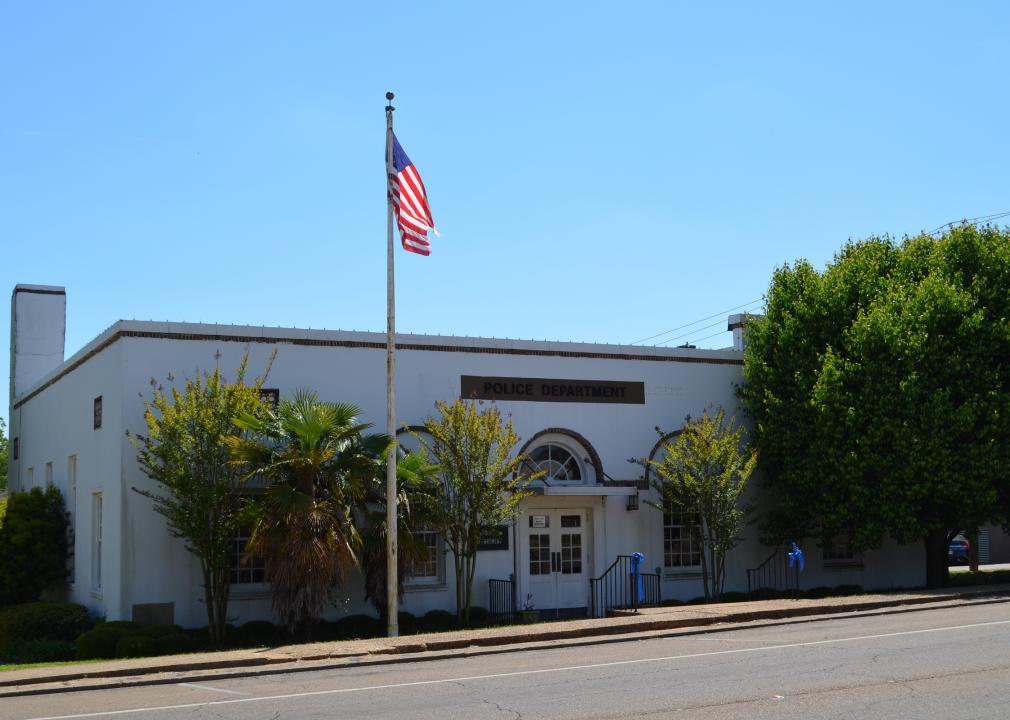
CapCase // Wikimedia Commons
#49. Neshoba County
– Median percent of income spent on housing: 17.3%
— Percent of households spending <20% of income on housing: 52.2%
— Percent of households spending >30% of income on housing: 23.8%
– Total occupied households: 10,657
– Median household income: $37,987
– Median monthly housing cost: $549
#48. Leake County
– Median percent of income spent on housing: 17.4%
— Percent of households spending <20% of income on housing: 52.2%
— Percent of households spending >30% of income on housing: 22.0%
– Total occupied households: 8,105
– Median household income: $37,096
– Median monthly housing cost: $538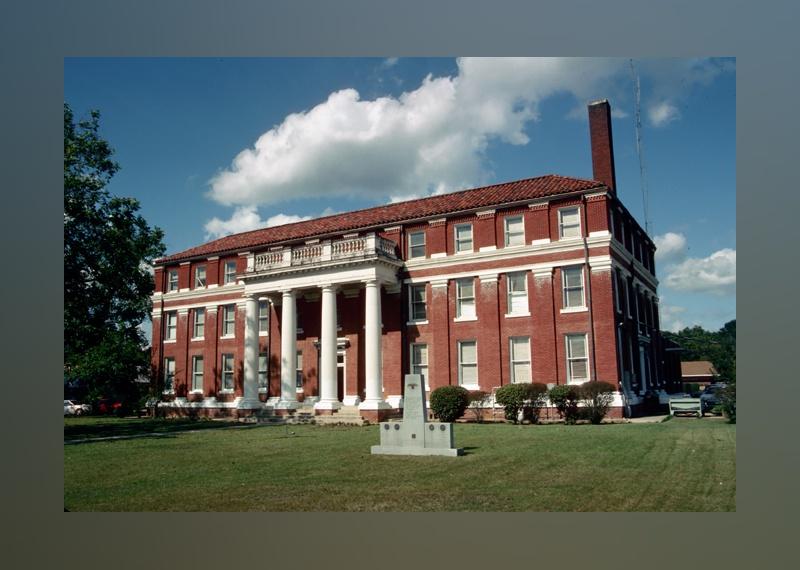
Calvin Beale // Wikimedia Commons
#47. Lawrence County
– Median percent of income spent on housing: 17.4%
— Percent of households spending <20% of income on housing: 54.4%
— Percent of households spending >30% of income on housing: 19.0%
– Total occupied households: 4,849
– Median household income: $41,914
– Median monthly housing cost: $608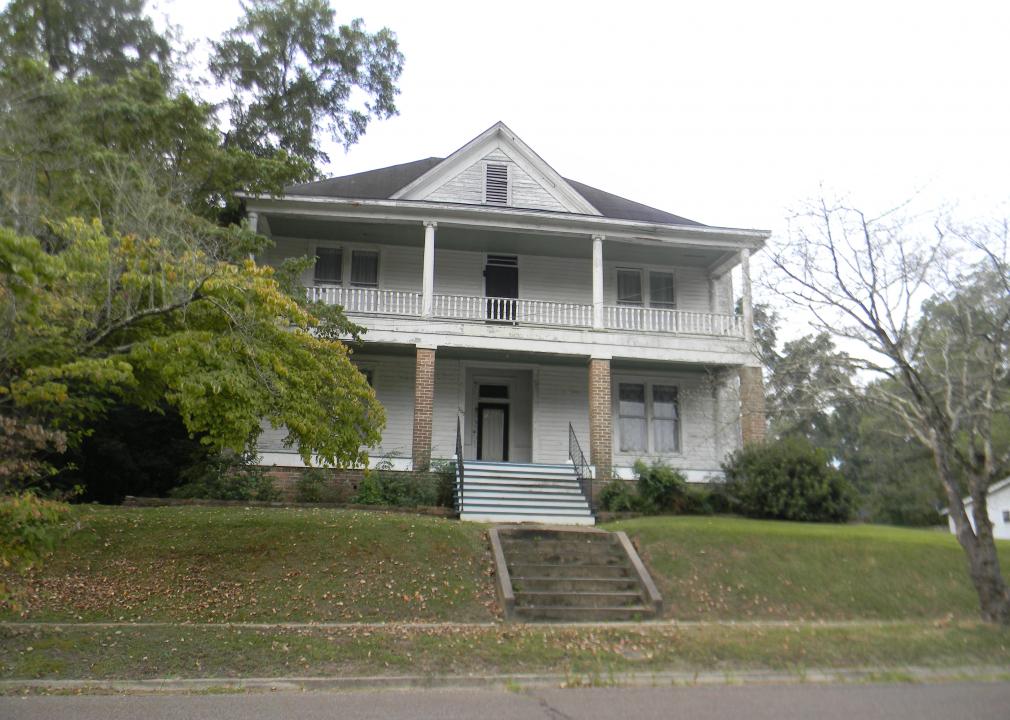
Brewri92535 // Wikimedia Commons
#46. Newton County
– Median percent of income spent on housing: 17.6%
— Percent of households spending <20% of income on housing: 54.7%
— Percent of households spending >30% of income on housing: 21.2%
– Total occupied households: 8,037
– Median household income: $35,958
– Median monthly housing cost: $526
You may also like: Highest-rated specialty museums in Mississippi, according to Tripadvisor
Gabriel D. May // Wikimedia Commons
#45. Marion County
– Median percent of income spent on housing: 17.7%
— Percent of households spending <20% of income on housing: 50.2%
— Percent of households spending >30% of income on housing: 27.8%
– Total occupied households: 9,483
– Median household income: $32,090
– Median monthly housing cost: $474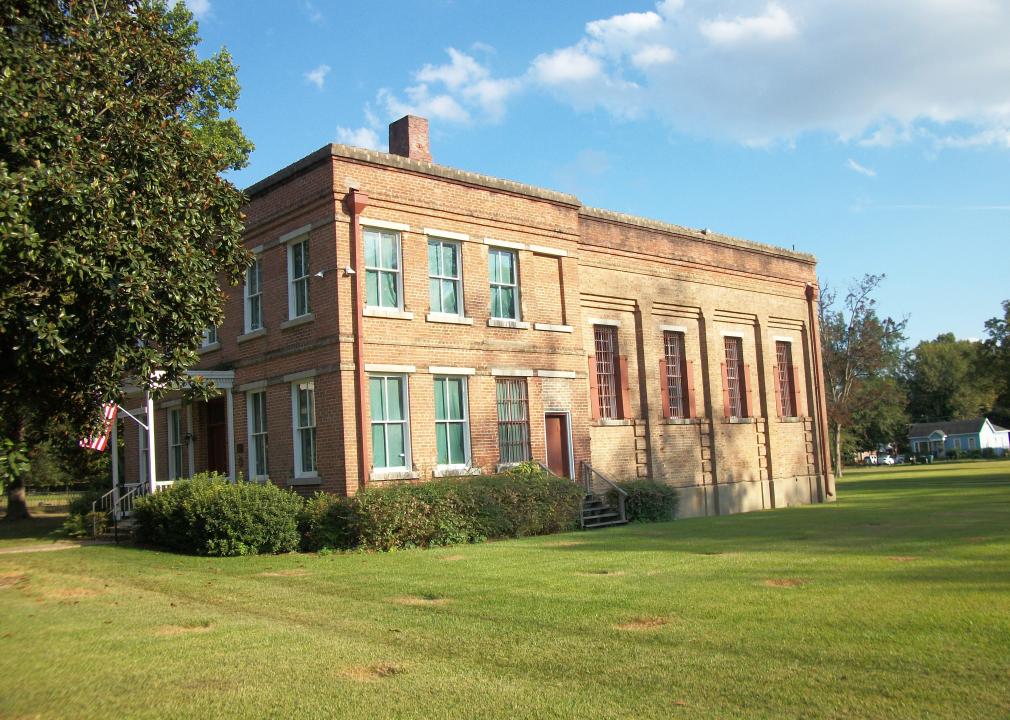
Scoutandboo // Wikimedia Commons
#44. Madison County
– Median percent of income spent on housing: 17.8%
— Percent of households spending <20% of income on housing: 53.3%
— Percent of households spending >30% of income on housing: 24.6%
– Total occupied households: 39,635
– Median household income: $71,824
– Median monthly housing cost: $1,064
#43. Tate County
– Median percent of income spent on housing: 17.8%
— Percent of households spending <20% of income on housing: 50.3%
— Percent of households spending >30% of income on housing: 26.0%
– Total occupied households: 10,324
– Median household income: $51,030
– Median monthly housing cost: $756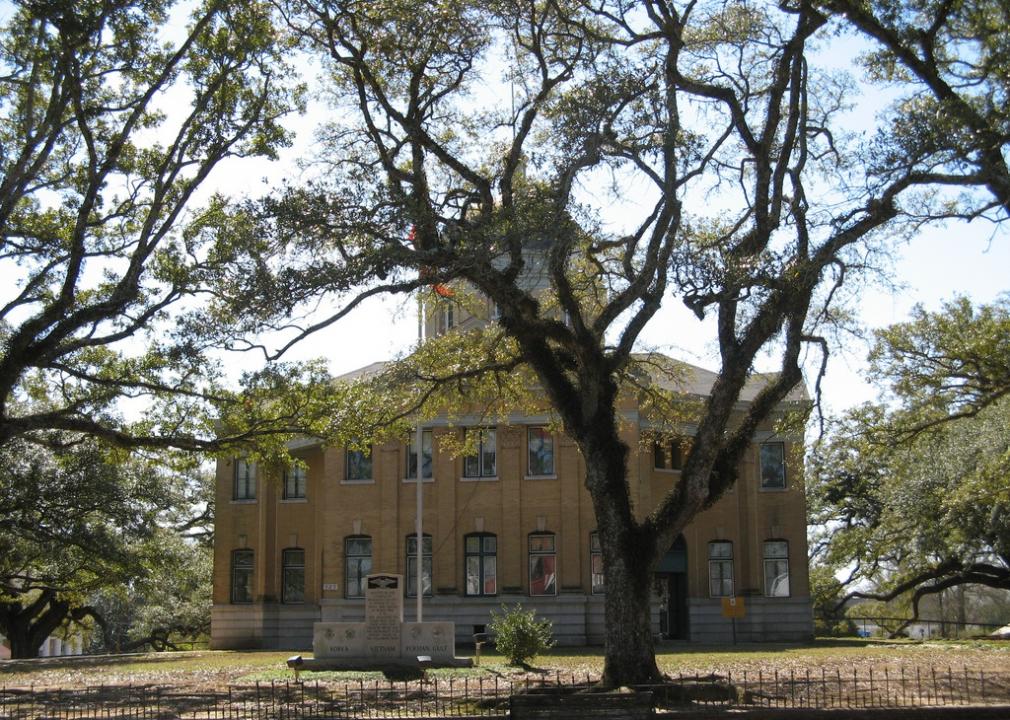
Natalie Maynor // Wikimedia Commons
#42. Wilkinson County
– Median percent of income spent on housing: 17.8%
— Percent of households spending <20% of income on housing: 49.6%
— Percent of households spending >30% of income on housing: 28.3%
– Total occupied households: 3,170
– Median household income: $27,313
– Median monthly housing cost: $406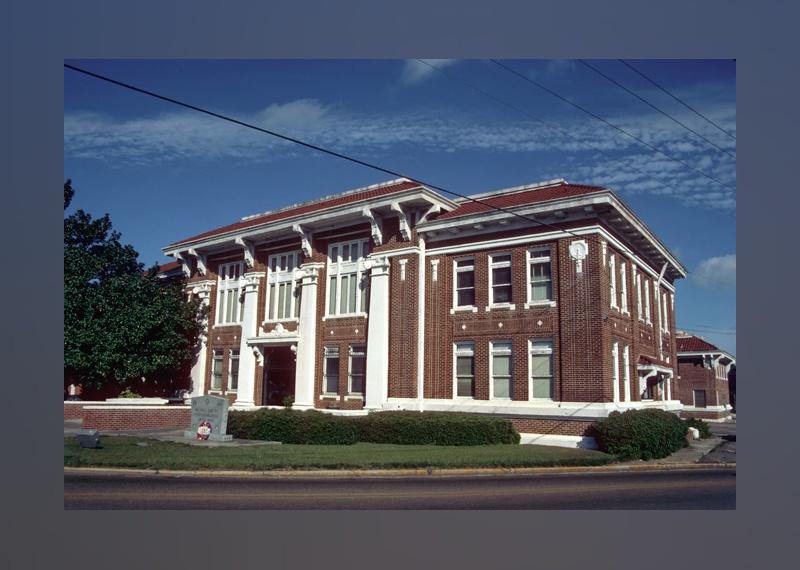
Calvin Beale // Wikimedia Commons
#41. Walthall County
– Median percent of income spent on housing: 17.9%
— Percent of households spending <20% of income on housing: 51.1%
— Percent of households spending >30% of income on housing: 27.1%
– Total occupied households: 5,601
– Median household income: $30,961
– Median monthly housing cost: $461
You may also like: Recipes from Mississippi
Rdstephens // Wikimedia Commons
#40. Noxubee County
– Median percent of income spent on housing: 18.0%
— Percent of households spending <20% of income on housing: 45.9%
— Percent of households spending >30% of income on housing: 25.6%
– Total occupied households: 3,986
– Median household income: $33,784
– Median monthly housing cost: $508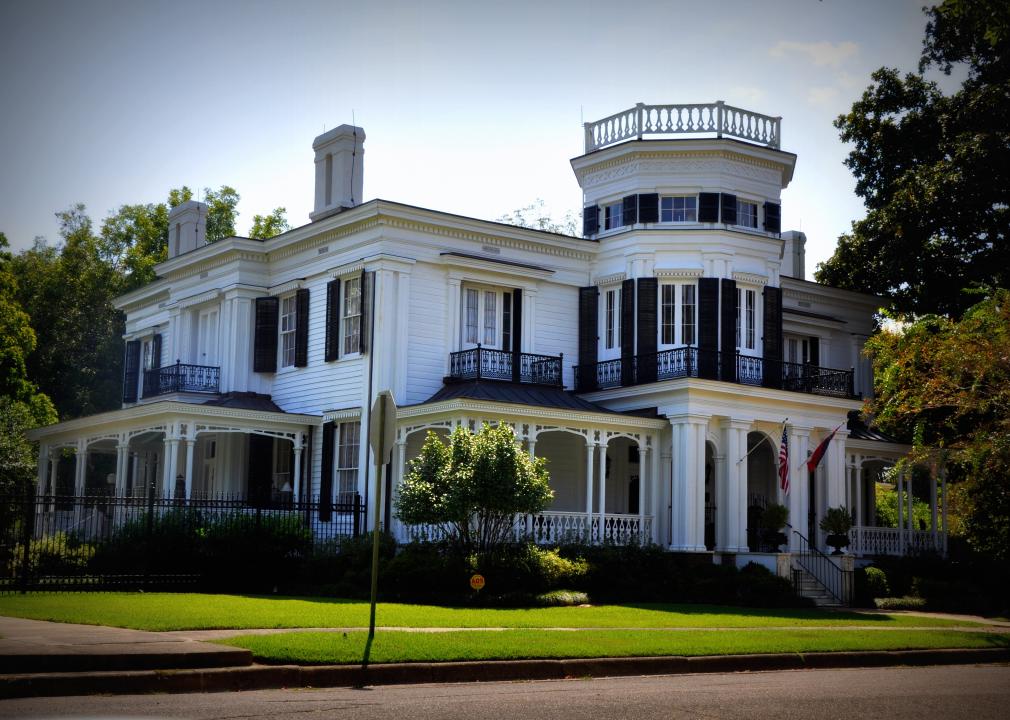
Leigh T. Harrell // Wikimedia Commons
#39. Lowndes County
– Median percent of income spent on housing: 18.1%
— Percent of households spending <20% of income on housing: 49.9%
— Percent of households spending >30% of income on housing: 28.3%
– Total occupied households: 22,436
– Median household income: $50,441
– Median monthly housing cost: $759
Cohee // Wikimedia Commons
#38. Lee County
– Median percent of income spent on housing: 18.3%
— Percent of households spending <20% of income on housing: 52.7%
— Percent of households spending >30% of income on housing: 24.9%
– Total occupied households: 32,099
– Median household income: $50,559
– Median monthly housing cost: $770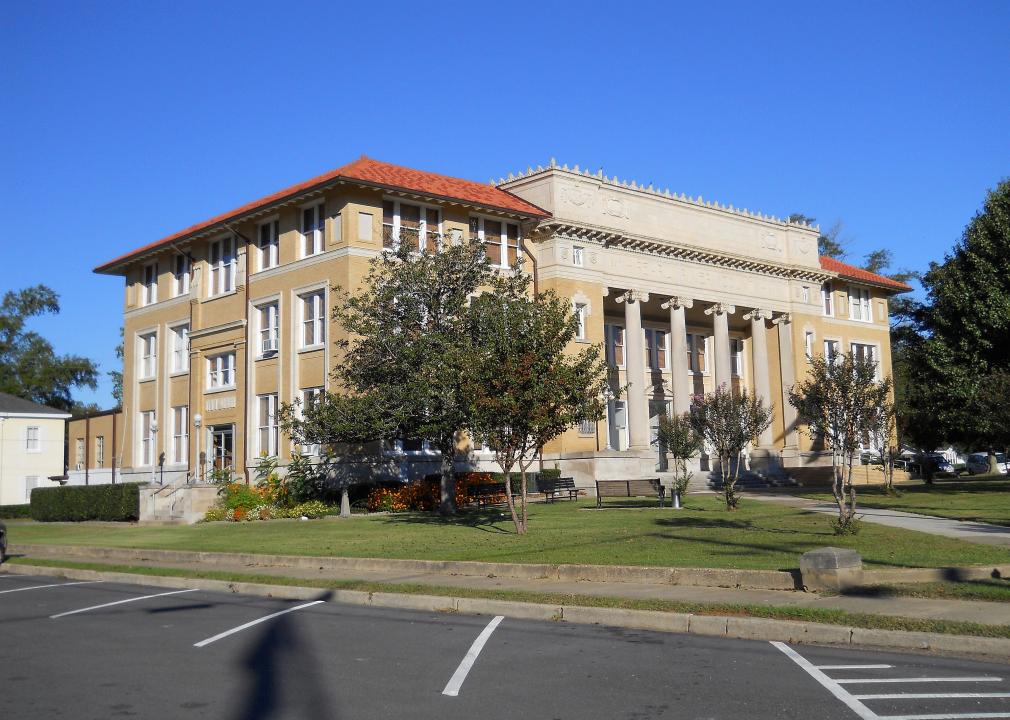
Woodlot // Wikimedia Commons
#37. Pearl River County
– Median percent of income spent on housing: 18.3%
— Percent of households spending <20% of income on housing: 54.6%
— Percent of households spending >30% of income on housing: 22.9%
– Total occupied households: 21,020
– Median household income: $46,901
– Median monthly housing cost: $716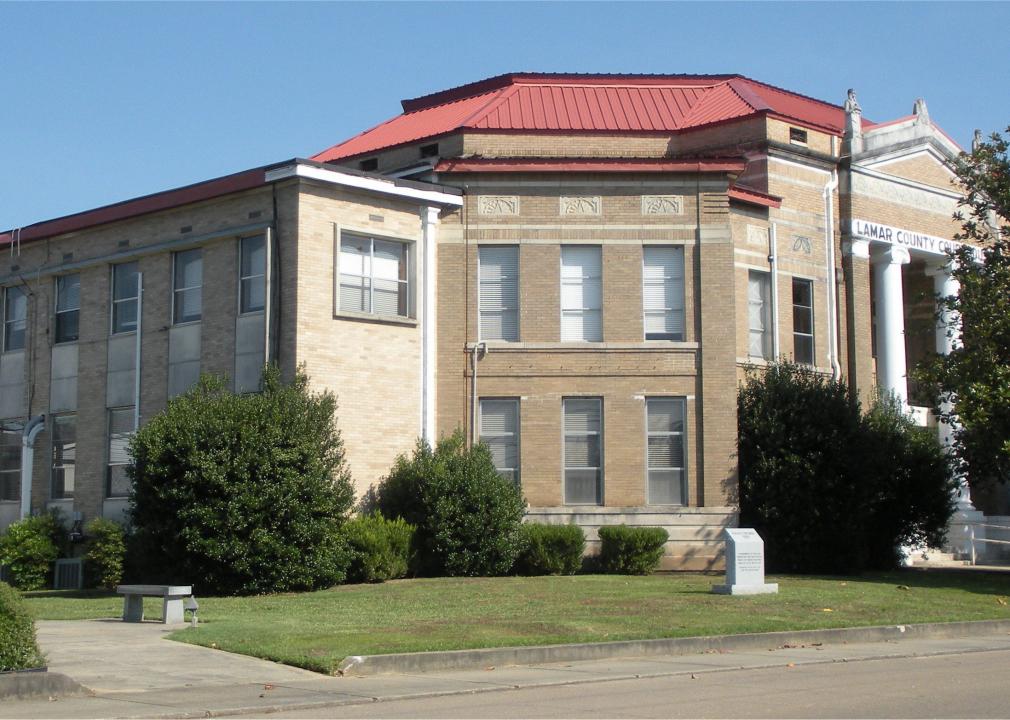
The diva777 // Wikimedia Commons
#36. Lamar County
– Median percent of income spent on housing: 18.4%
— Percent of households spending <20% of income on housing: 53.7%
— Percent of households spending >30% of income on housing: 23.5%
– Total occupied households: 22,116
– Median household income: $60,328
– Median monthly housing cost: $924
You may also like: Highest-rated Class of 2021 football recruits from Mississippi
#35. DeSoto County
– Median percent of income spent on housing: 18.6%
— Percent of households spending <20% of income on housing: 55.3%
— Percent of households spending >30% of income on housing: 22.7%
– Total occupied households: 62,890
– Median household income: $67,038
– Median monthly housing cost: $1,040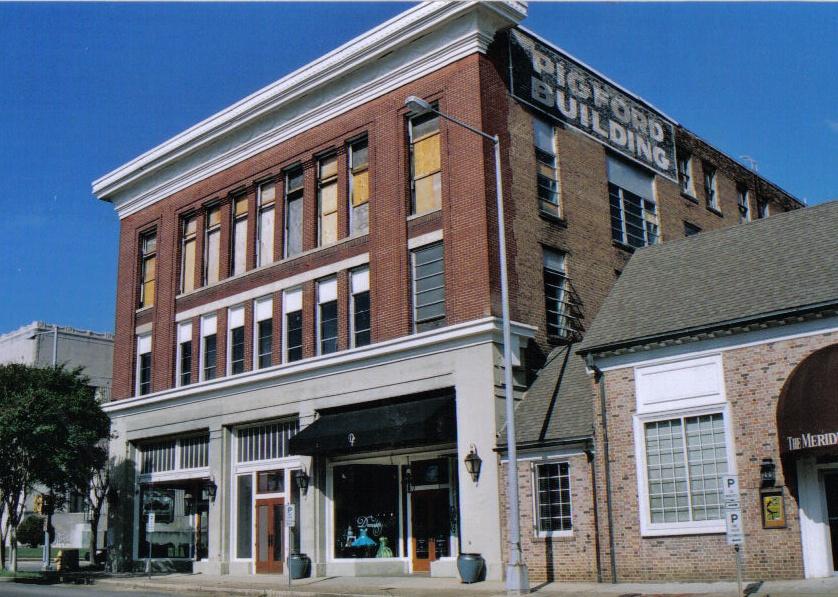
Dudemanfellabra // Wikimedia Commons
#34. Lauderdale County
– Median percent of income spent on housing: 18.9%
— Percent of households spending <20% of income on housing: 48.3%
— Percent of households spending >30% of income on housing: 27.2%
– Total occupied households: 29,736
– Median household income: $42,534
– Median monthly housing cost: $671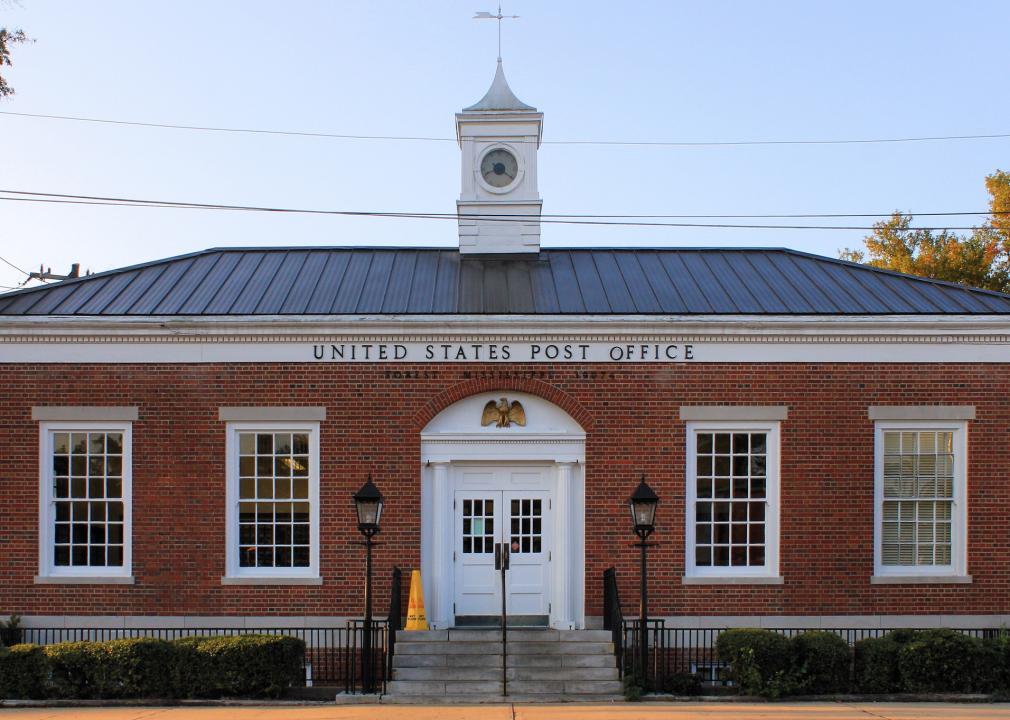
Larry D. Moore // Wikimedia Commons
#33. Scott County
– Median percent of income spent on housing: 19.0%
— Percent of households spending <20% of income on housing: 51.0%
— Percent of households spending >30% of income on housing: 23.9%
– Total occupied households: 10,180
– Median household income: $34,943
– Median monthly housing cost: $553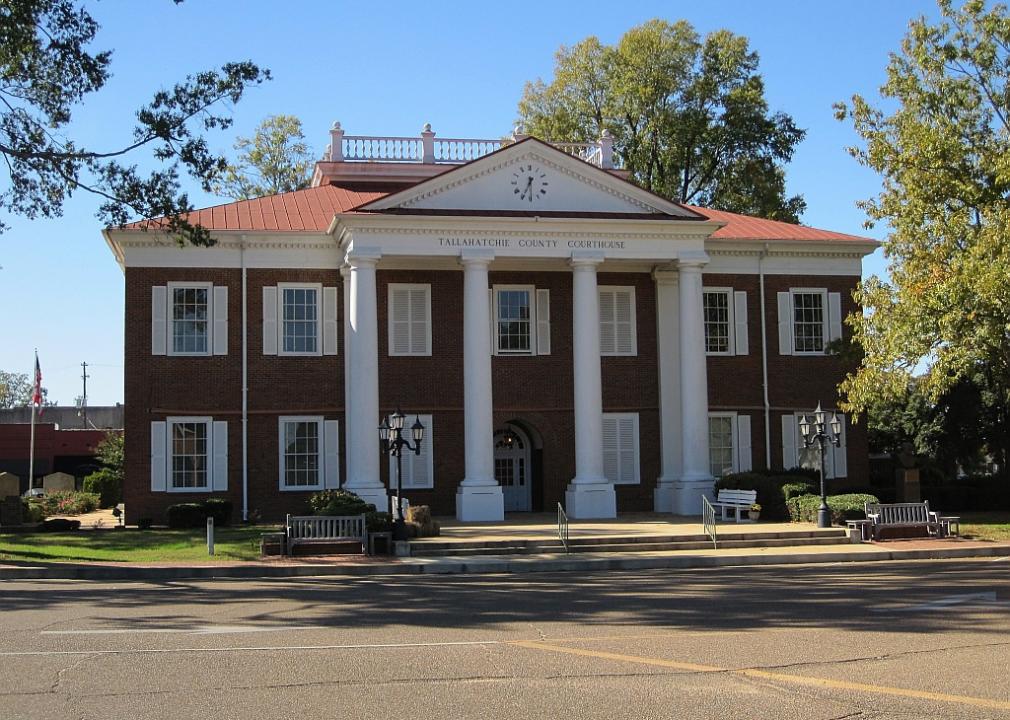
Thomas R Machnitzki // Wikimedia Commons
#32. Tallahatchie County
– Median percent of income spent on housing: 19.0%
— Percent of households spending <20% of income on housing: 45.5%
— Percent of households spending >30% of income on housing: 26.2%
– Total occupied households: 4,369
– Median household income: $29,864
– Median monthly housing cost: $474
#31. Chickasaw County
– Median percent of income spent on housing: 19.1%
— Percent of households spending <20% of income on housing: 49.3%
— Percent of households spending >30% of income on housing: 24.9%
– Total occupied households: 6,476
– Median household income: $36,548
– Median monthly housing cost: $583
You may also like: Biggest sources of immigrants to Mississippi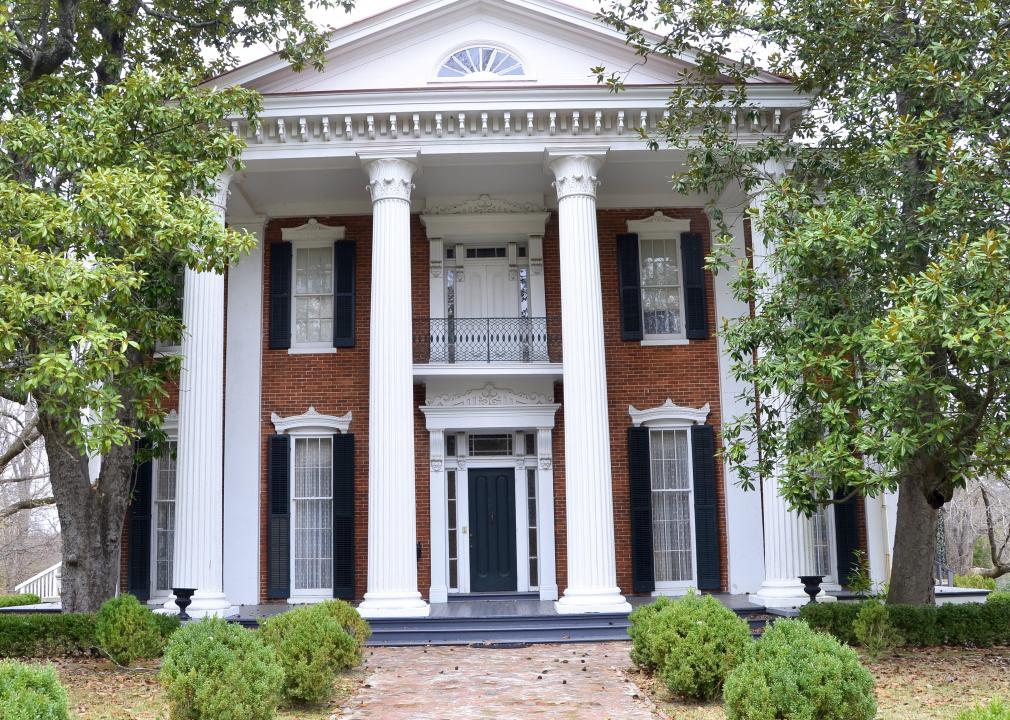
Magnolia677 // Wikimedia Commons
#30. Marshall County
– Median percent of income spent on housing: 19.2%
— Percent of households spending <20% of income on housing: 52.7%
— Percent of households spending >30% of income on housing: 25.3%
– Total occupied households: 12,772
– Median household income: $42,233
– Median monthly housing cost: $674
Renelibrary // Wikimedia Commons
#29. Warren County
– Median percent of income spent on housing: 19.3%
— Percent of households spending <20% of income on housing: 48.5%
— Percent of households spending >30% of income on housing: 30.8%
– Total occupied households: 18,235
– Median household income: $45,113
– Median monthly housing cost: $727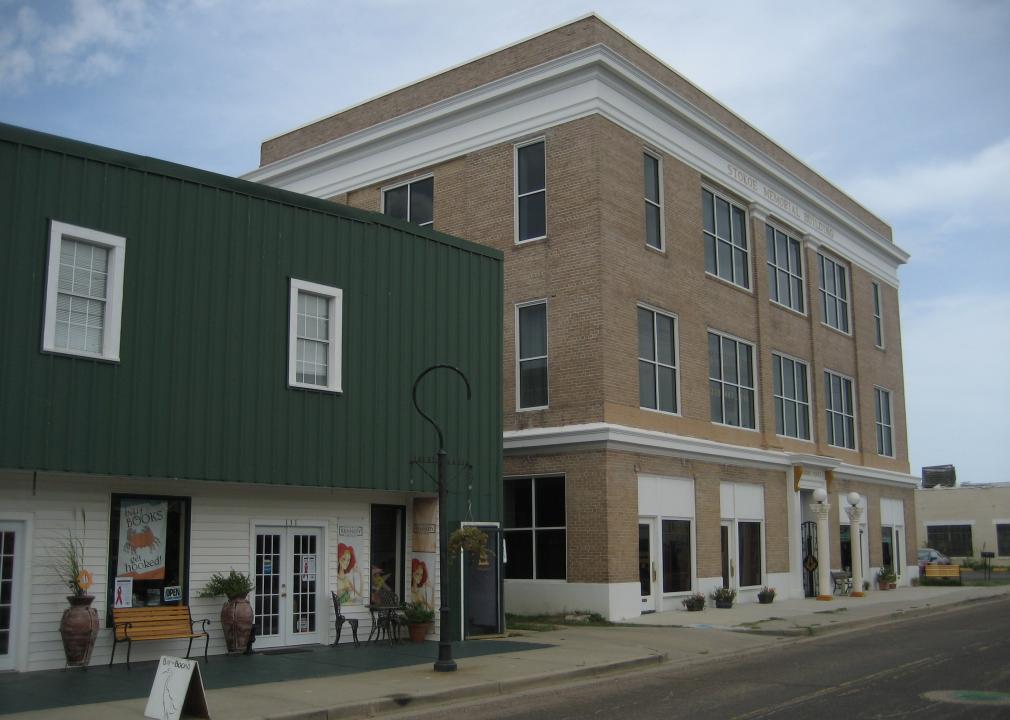
Infrogmation of New Orleans // Wikimedia Commons
#28. Hancock County
– Median percent of income spent on housing: 19.4%
— Percent of households spending <20% of income on housing: 50.8%
— Percent of households spending >30% of income on housing: 25.8%
– Total occupied households: 20,036
– Median household income: $48,119
– Median monthly housing cost: $779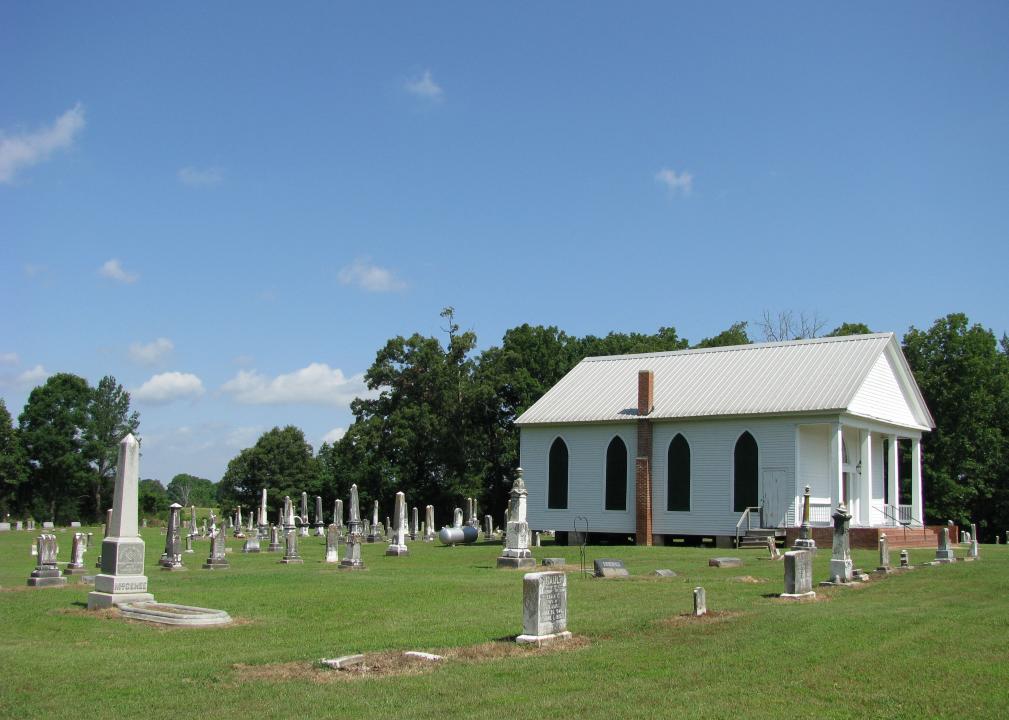
NatalieMaynor // Wikimedia Commons
#27. Panola County
– Median percent of income spent on housing: 19.5%
— Percent of households spending <20% of income on housing: 47.4%
— Percent of households spending >30% of income on housing: 25.3%
– Total occupied households: 12,488
– Median household income: $38,304
– Median monthly housing cost: $622
Quentin Melson // Wikimedia Commons
#26. Jackson County
– Median percent of income spent on housing: 19.6%
— Percent of households spending <20% of income on housing: 49.9%
— Percent of households spending >30% of income on housing: 26.3%
– Total occupied households: 52,423
– Median household income: $51,657
– Median monthly housing cost: $843
You may also like: Counties with the most college graduates in Mississippi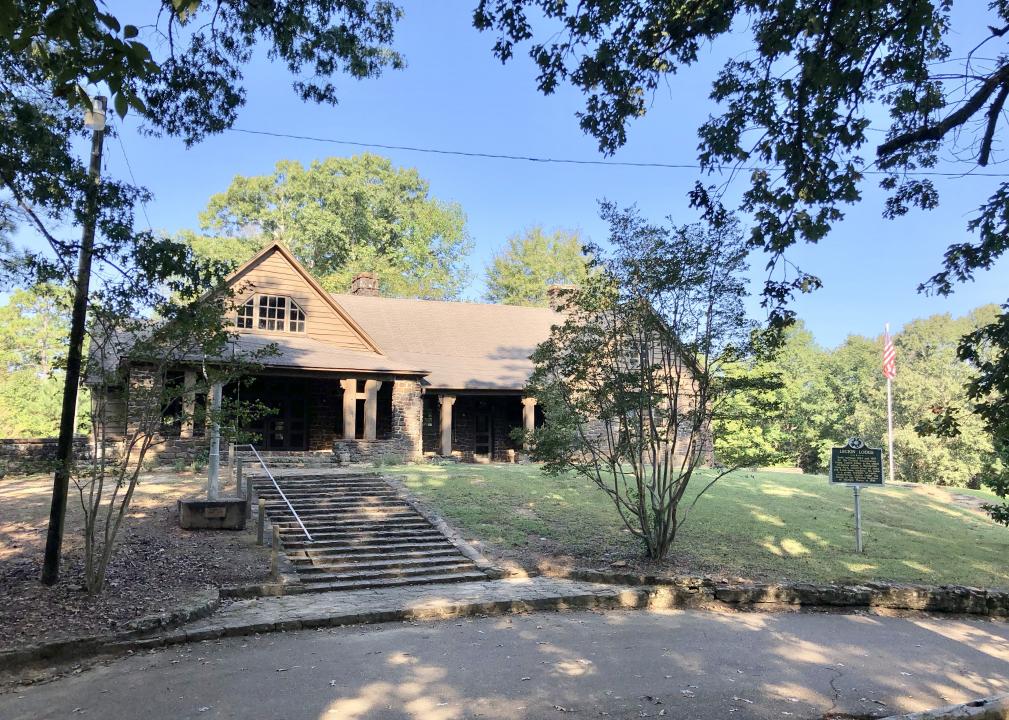
Mark Hilton // Wikimedia Commons
#25. Winston County
– Median percent of income spent on housing: 19.6%
— Percent of households spending <20% of income on housing: 49.4%
— Percent of households spending >30% of income on housing: 24.6%
– Total occupied households: 7,269
– Median household income: $34,724
– Median monthly housing cost: $568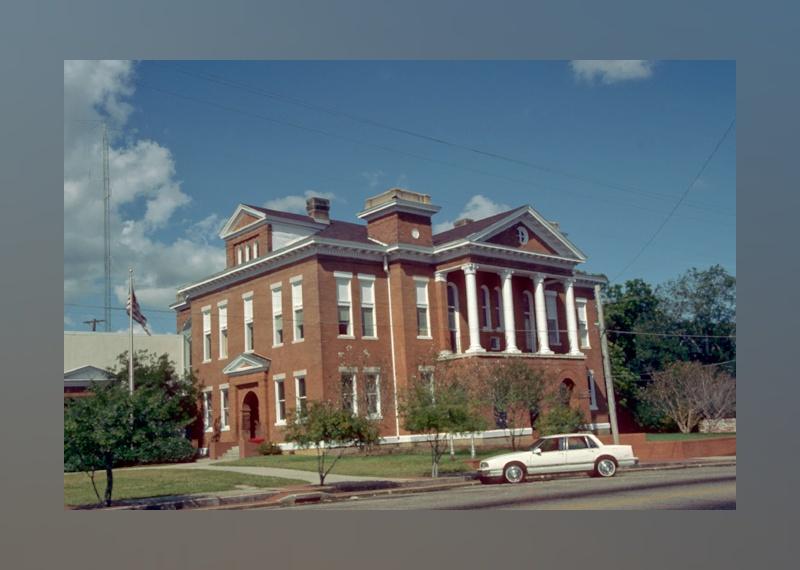
Calvin Beale // Wikimedia Commons
#24. Jefferson Davis County
– Median percent of income spent on housing: 19.9%
— Percent of households spending <20% of income on housing: 47.5%
— Percent of households spending >30% of income on housing: 26.7%
– Total occupied households: 4,713
– Median household income: $32,116
– Median monthly housing cost: $533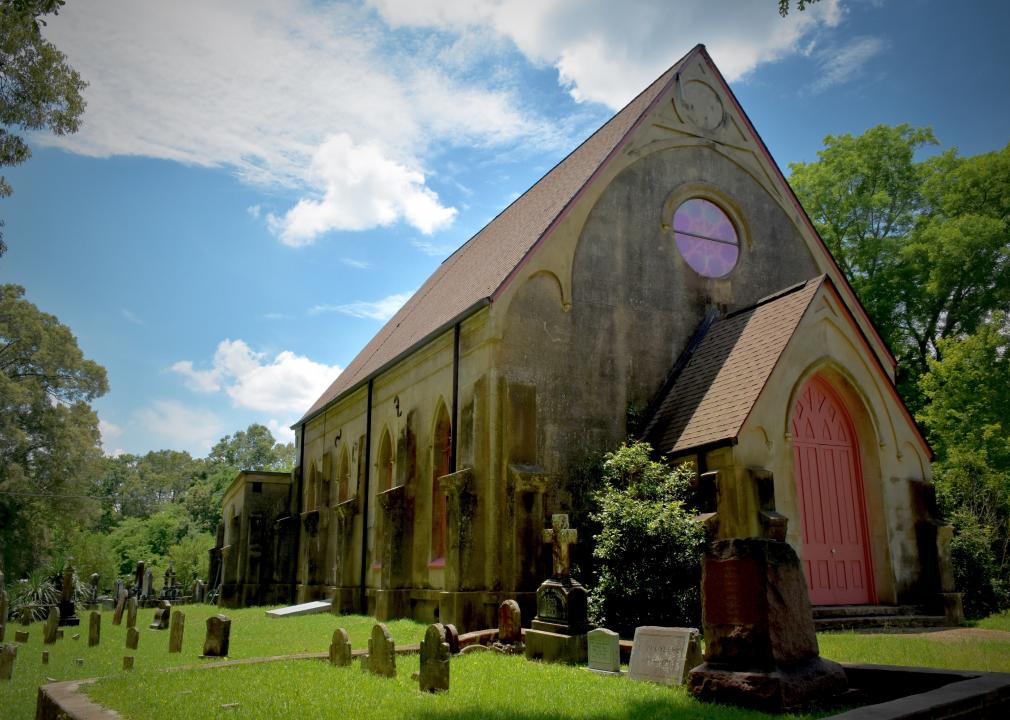
Mthunter58 // Wikimedia Commons
#23. Jefferson County
– Median percent of income spent on housing: 20.0%
— Percent of households spending <20% of income on housing: 41.3%
— Percent of households spending >30% of income on housing: 22.6%
– Total occupied households: 2,448
– Median household income: $25,019
– Median monthly housing cost: $418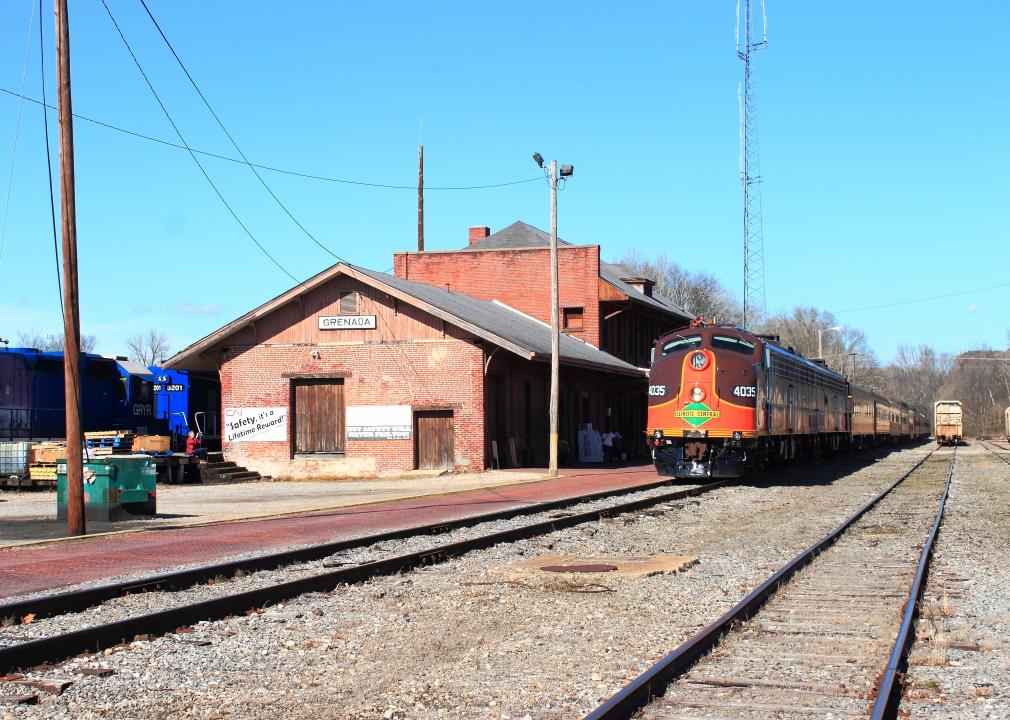
Matthew Nichols // Wikimedia Commons
#22. Grenada County
– Median percent of income spent on housing: 20.1%
— Percent of households spending <20% of income on housing: 48.3%
— Percent of households spending >30% of income on housing: 26.6%
– Total occupied households: 8,391
– Median household income: $40,122
– Median monthly housing cost: $672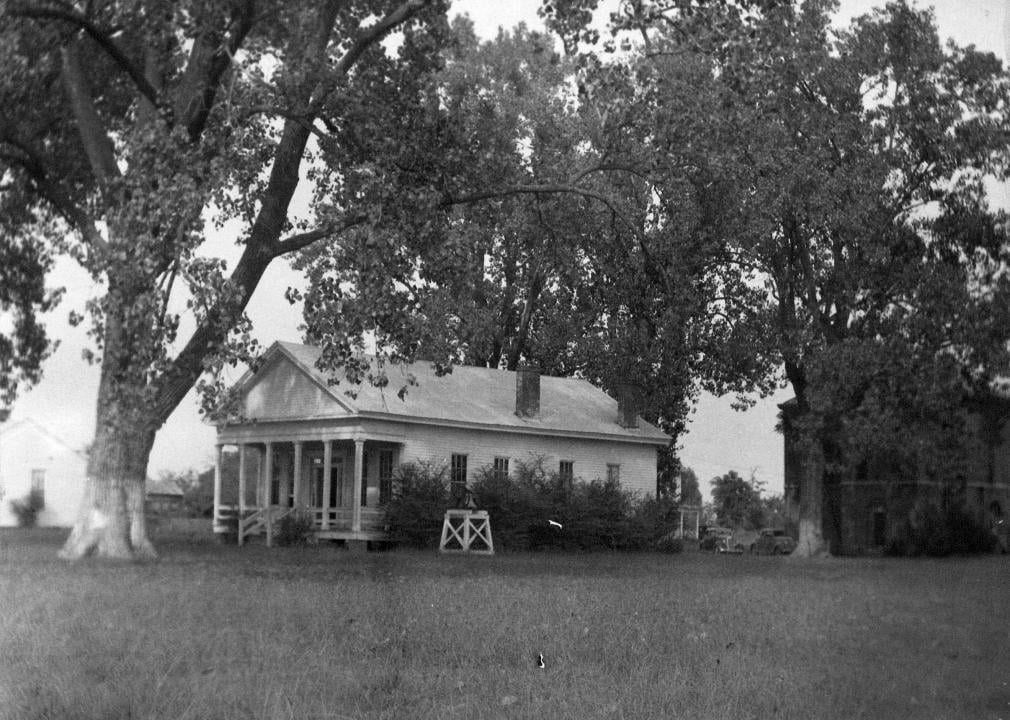
Mississippi Department of Archives and History // Wikimedia Commons
#21. Issaquena County
– Median percent of income spent on housing: 20.7%
— Percent of households spending <20% of income on housing: 35.8%
— Percent of households spending >30% of income on housing: 27.5%
– Total occupied households: 483
– Median household income: $24,208
– Median monthly housing cost: $418
You may also like: Where people in Mississippi are moving to most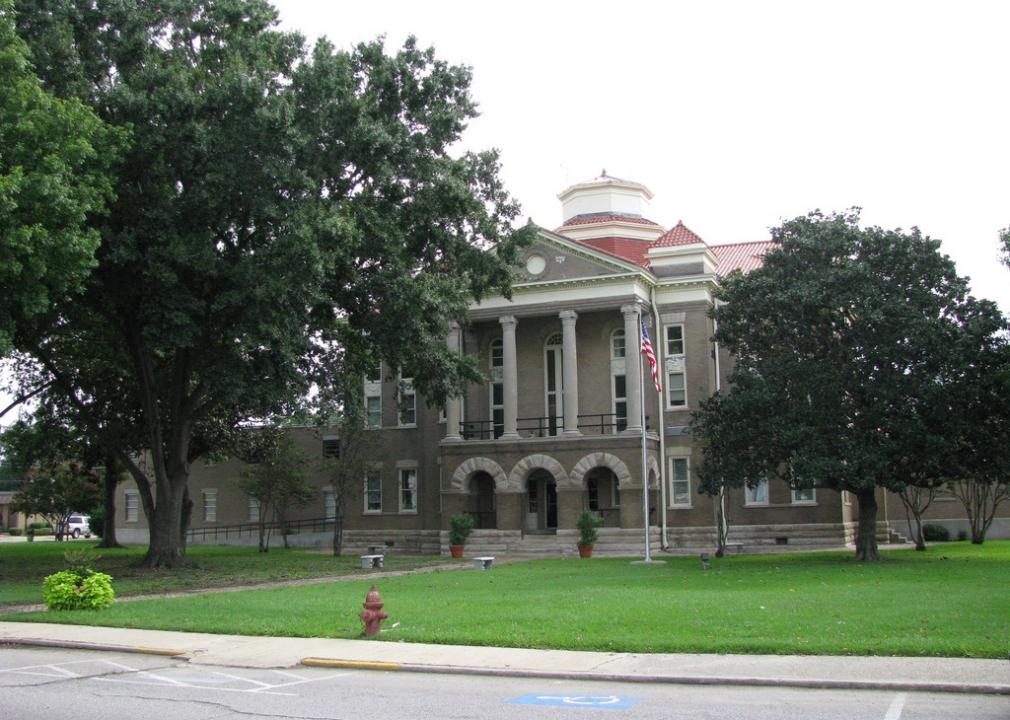
Natalie Maynor // Wikimedia Commons
#20. Sharkey County
– Median percent of income spent on housing: 21.2%
— Percent of households spending <20% of income on housing: 39.8%
— Percent of households spending >30% of income on housing: 28.6%
– Total occupied households: 1,751
– Median household income: $29,394
– Median monthly housing cost: $519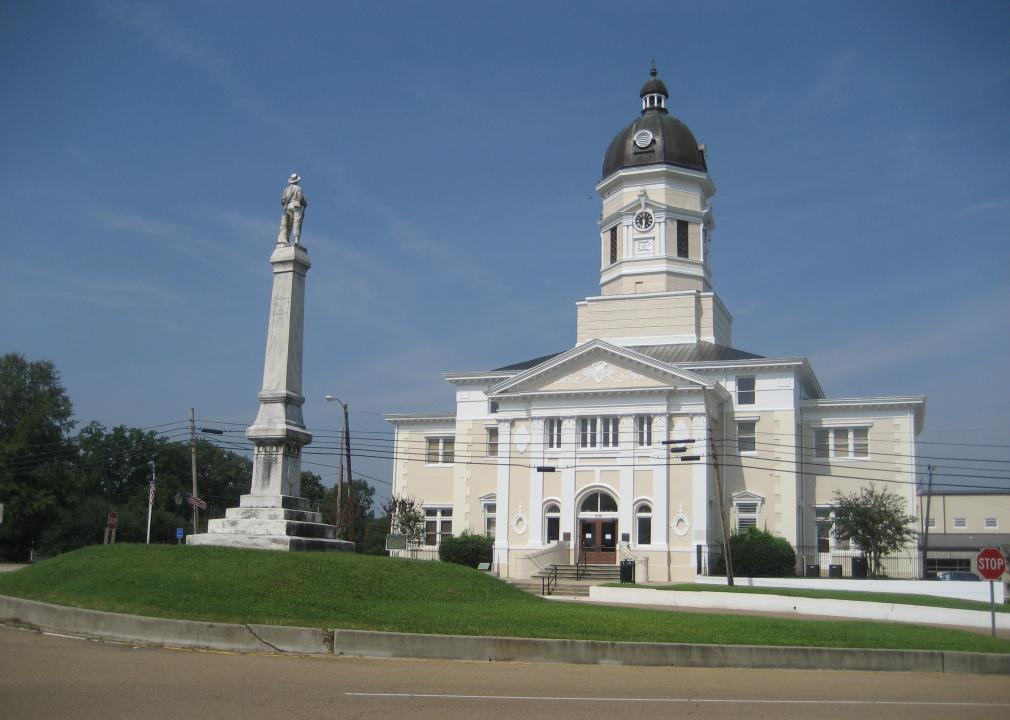
Infrogmation of New Orleans // Wikimedia Commons
#19. Claiborne County
– Median percent of income spent on housing: 21.5%
— Percent of households spending <20% of income on housing: 47.7%
— Percent of households spending >30% of income on housing: 19.0%
– Total occupied households: 2,908
– Median household income: $29,338
– Median monthly housing cost: $526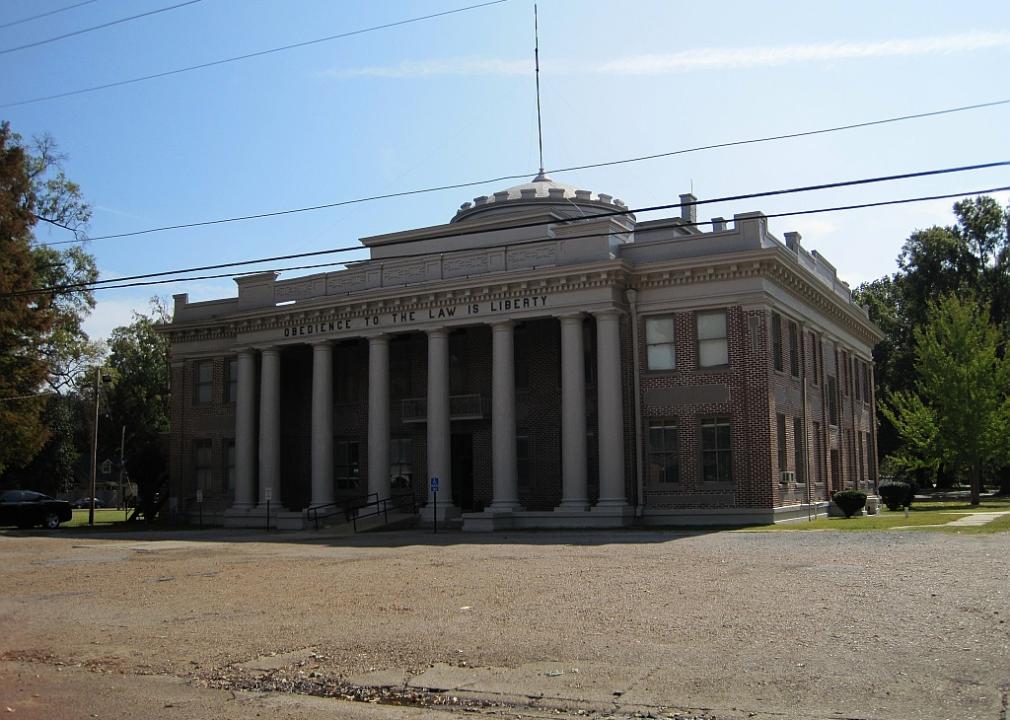
Thomas R Machnitzki (thomas@machnitzki.com) // Wikimedia Commons
#18. Quitman County
– Median percent of income spent on housing: 21.5%
— Percent of households spending <20% of income on housing: 42.9%
— Percent of households spending >30% of income on housing: 26.6%
– Total occupied households: 3,027
– Median household income: $25,283
– Median monthly housing cost: $454
Woodlot // Wikimedia Commons
#17. Harrison County
– Median percent of income spent on housing: 21.8%
— Percent of households spending <20% of income on housing: 43.6%
— Percent of households spending >30% of income on housing: 32.9%
– Total occupied households: 78,104
– Median household income: $47,894
– Median monthly housing cost: $869
Chillin662 // Wikimedia Commons
#16. Yazoo County
– Median percent of income spent on housing: 21.9%
— Percent of households spending <20% of income on housing: 42.8%
— Percent of households spending >30% of income on housing: 26.9%
– Total occupied households: 8,542
– Median household income: $33,279
– Median monthly housing cost: $606
You may also like: Highest-rated things to do in Mississippi, according to Tripadvisor
Z28scrambler // Wikimedia Commons
#15. Pike County
– Median percent of income spent on housing: 22.0%
— Percent of households spending <20% of income on housing: 42.4%
— Percent of households spending >30% of income on housing: 30.0%
– Total occupied households: 14,404
– Median household income: $31,784
– Median monthly housing cost: $584
Chris Crookston // Wikimedia Commons
#14. Coahoma County
– Median percent of income spent on housing: 22.3%
— Percent of households spending <20% of income on housing: 43.5%
— Percent of households spending >30% of income on housing: 30.1%
– Total occupied households: 8,782
– Median household income: $29,121
– Median monthly housing cost: $540
Sturmgewehr88 // Wikimedia
#13. Forrest County
– Median percent of income spent on housing: 22.3%
— Percent of households spending <20% of income on housing: 43.6%
— Percent of households spending >30% of income on housing: 33.1%
– Total occupied households: 28,086
– Median household income: $39,840
– Median monthly housing cost: $739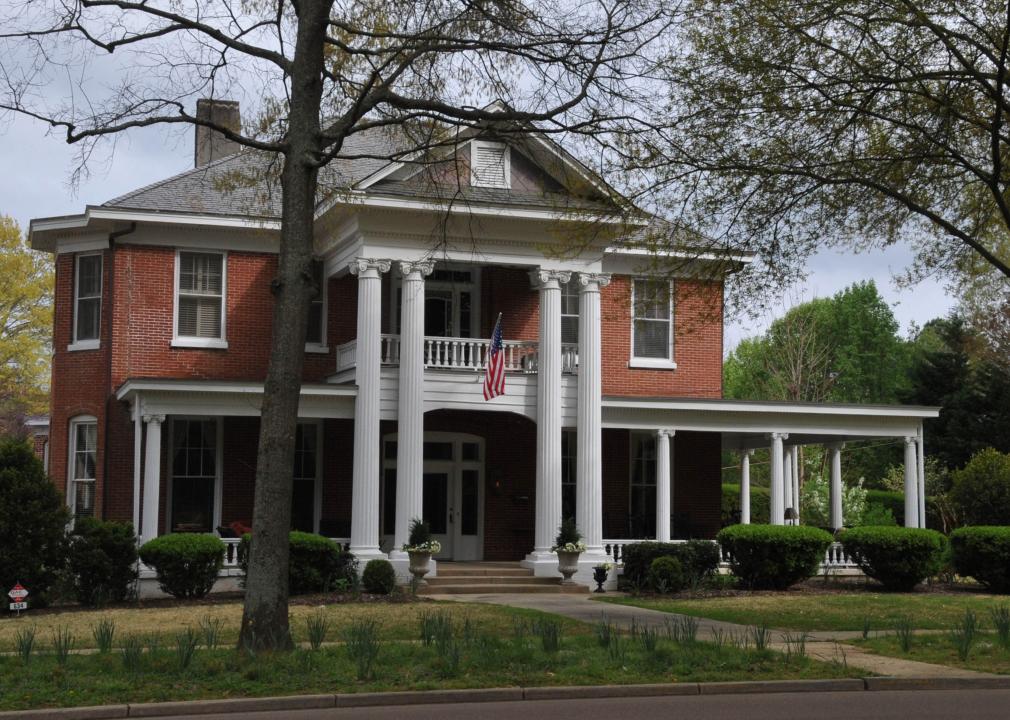
Jerrye & Roy Klotz, MD // Wikimedia Commons
#12. Lafayette County
– Median percent of income spent on housing: 22.5%
— Percent of households spending <20% of income on housing: 44.3%
— Percent of households spending >30% of income on housing: 32.4%
– Total occupied households: 18,721
– Median household income: $50,272
– Median monthly housing cost: $942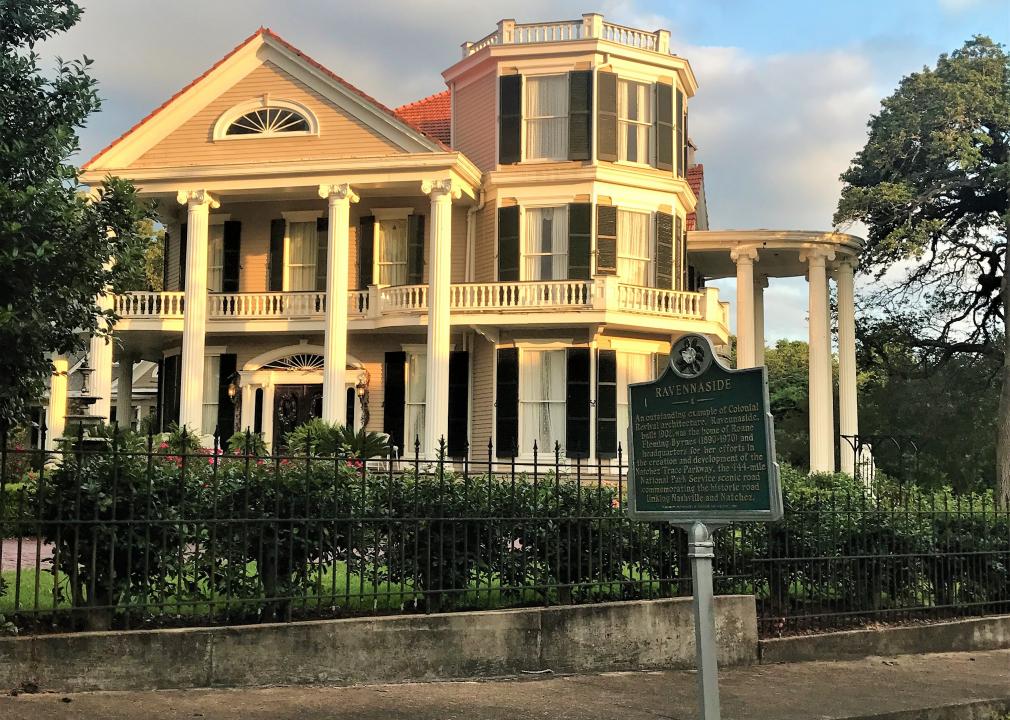
Z28scrambler // Wikimedia Commons
#11. Adams County
– Median percent of income spent on housing: 22.5%
— Percent of households spending <20% of income on housing: 42.6%
— Percent of households spending >30% of income on housing: 26.2%
– Total occupied households: 11,237
– Median household income: $29,936
– Median monthly housing cost: $561
You may also like: Most popular girl names in the 70s in Mississippi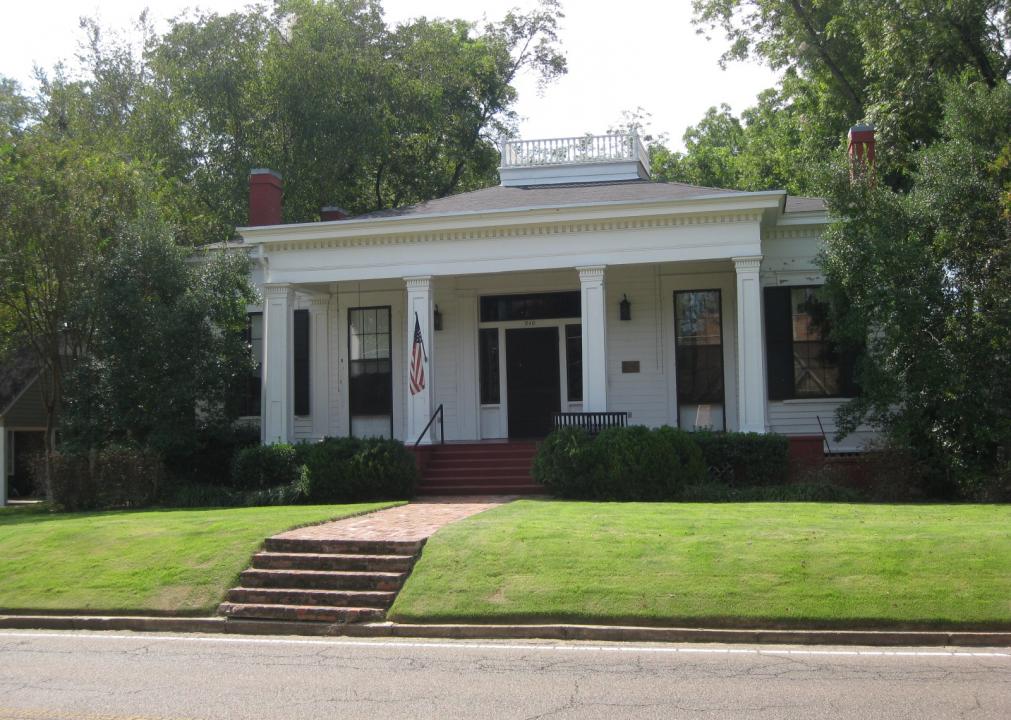
Carlcath // Wikimedia Commons
#10. Clay County
– Median percent of income spent on housing: 22.8%
— Percent of households spending <20% of income on housing: 48.3%
— Percent of households spending >30% of income on housing: 27.6%
– Total occupied households: 7,618
– Median household income: $31,833
– Median monthly housing cost: $605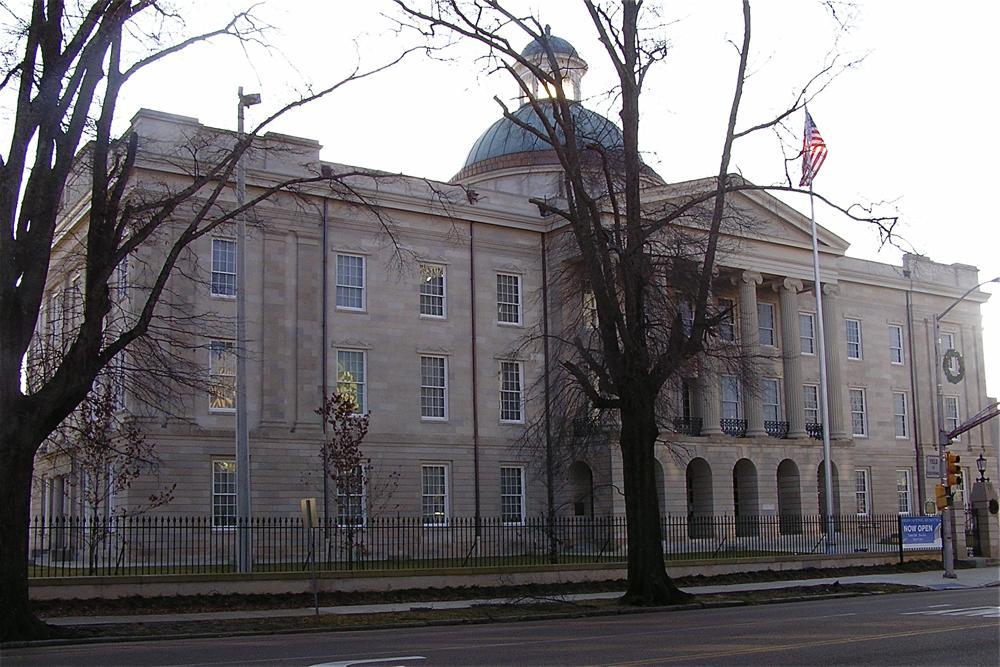
Michlaovic // Wikimedia
#9. Hinds County
– Median percent of income spent on housing: 23.0%
— Percent of households spending <20% of income on housing: 42.3%
— Percent of households spending >30% of income on housing: 32.3%
– Total occupied households: 88,611
– Median household income: $44,625
– Median monthly housing cost: $854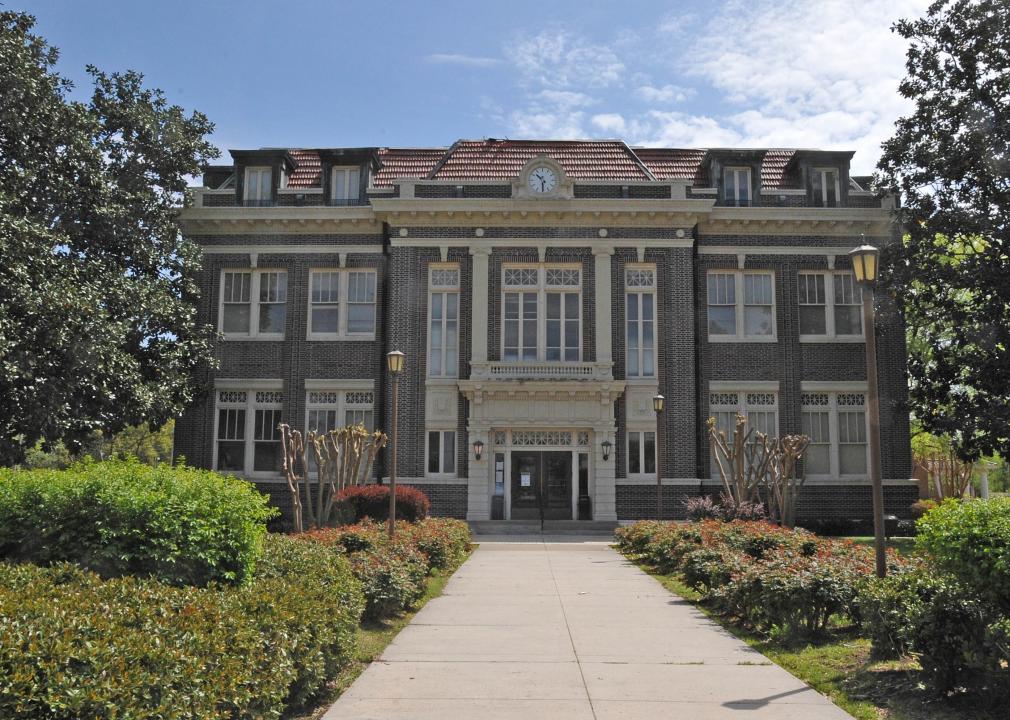
Jerrye & Roy Klotz, MD // Wikimedia Commons
#8. Tunica County
– Median percent of income spent on housing: 23.1%
— Percent of households spending <20% of income on housing: 44.9%
— Percent of households spending >30% of income on housing: 30.4%
– Total occupied households: 3,930
– Median household income: $39,370
– Median monthly housing cost: $757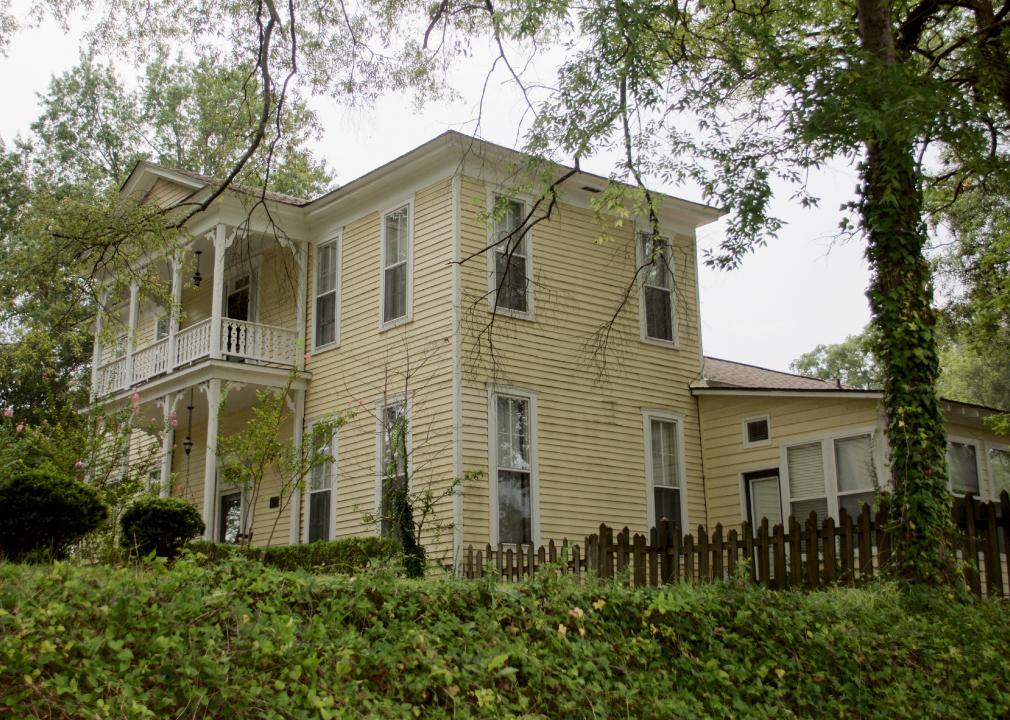
Mthunter58 // Wikimedia Commons
#7. Oktibbeha County
– Median percent of income spent on housing: 23.1%
— Percent of households spending <20% of income on housing: 44.1%
— Percent of households spending >30% of income on housing: 31.7%
– Total occupied households: 17,798
– Median household income: $40,453
– Median monthly housing cost: $780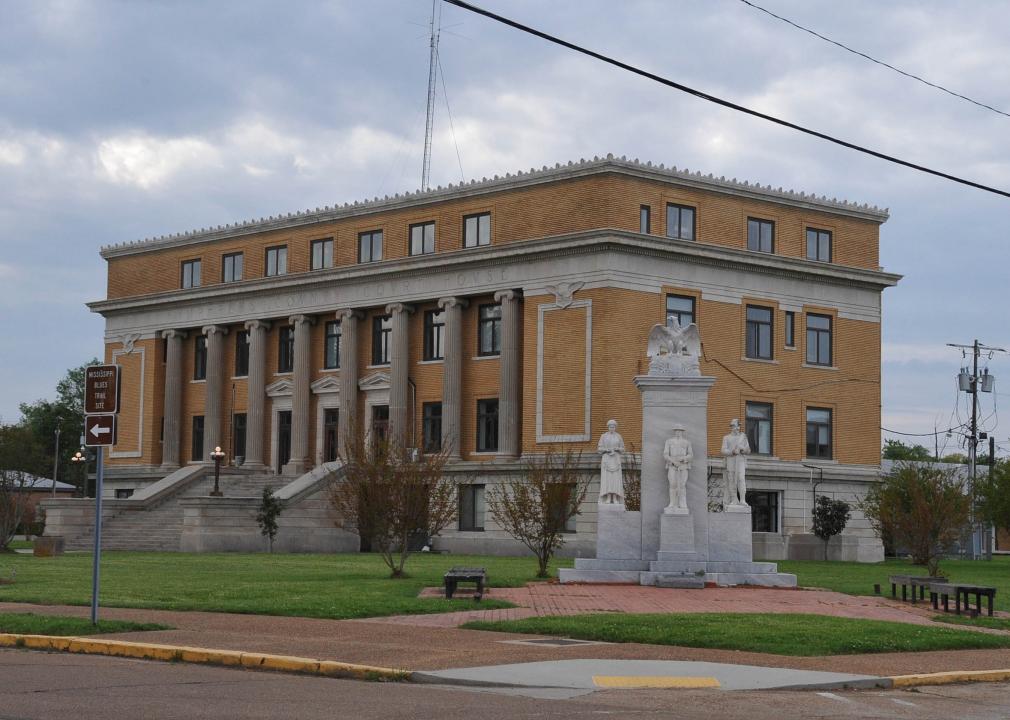
Jerrye & Roy Klotz, MD // Wikimedia Commons
#6. Humphreys County
– Median percent of income spent on housing: 23.5%
— Percent of households spending <20% of income on housing: 40.1%
— Percent of households spending >30% of income on housing: 32.8%
– Total occupied households: 3,186
– Median household income: $28,962
– Median monthly housing cost: $567
You may also like: Most popular girl names in the 60s in Mississippi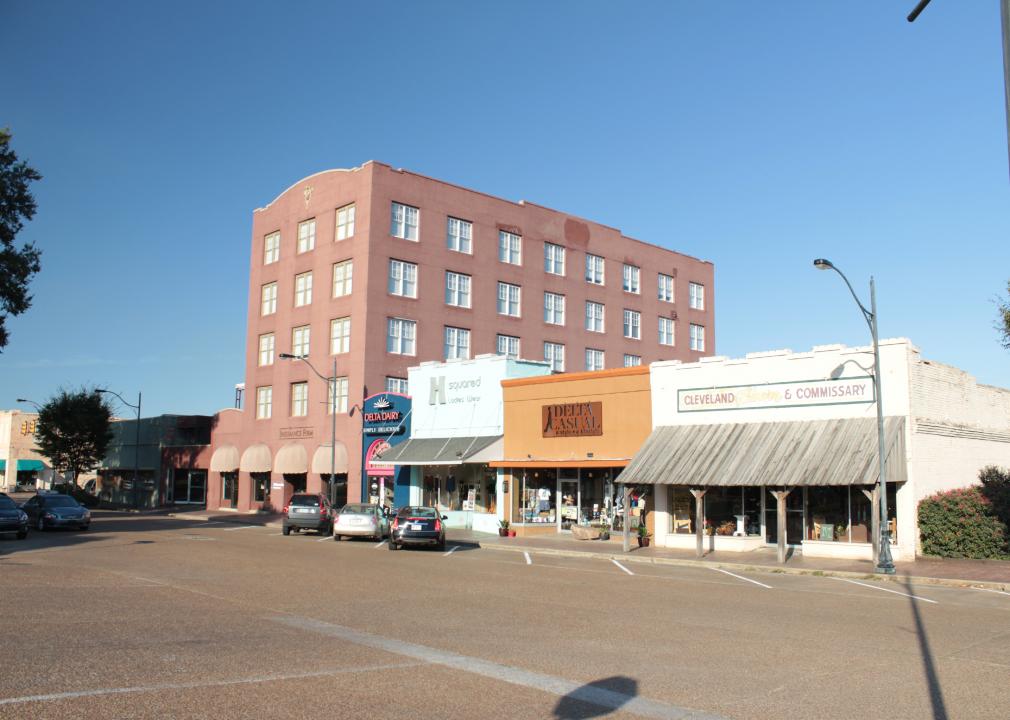
Hamhari Brown // Wikimedia Commons
#5. Bolivar County
– Median percent of income spent on housing: 24.2%
— Percent of households spending <20% of income on housing: 42.3%
— Percent of households spending >30% of income on housing: 33.0%
– Total occupied households: 12,111
– Median household income: $29,854
– Median monthly housing cost: $602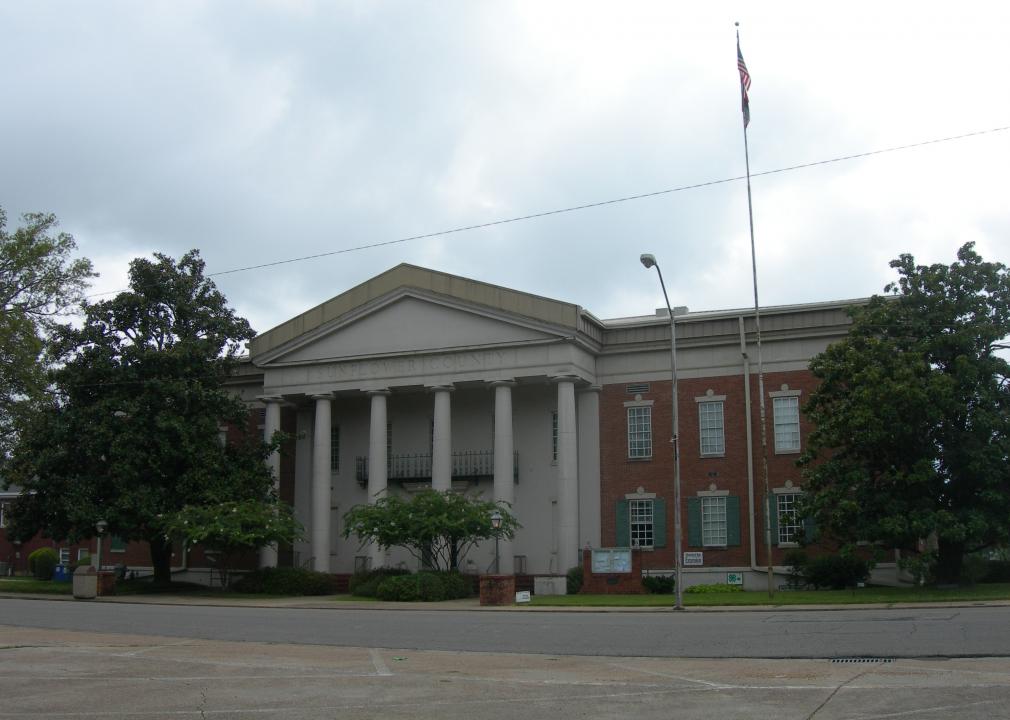
Jimmy Emerson from Dalton GA // Wikimedia Commons
#4. Sunflower County
– Median percent of income spent on housing: 24.2%
— Percent of households spending <20% of income on housing: 43.5%
— Percent of households spending >30% of income on housing: 32.9%
– Total occupied households: 8,322
– Median household income: $30,838
– Median monthly housing cost: $623
Nicholas Brown // Wikimedia Commons
#3. Washington County
– Median percent of income spent on housing: 25.5%
— Percent of households spending <20% of income on housing: 40.3%
— Percent of households spending >30% of income on housing: 35.3%
– Total occupied households: 17,988
– Median household income: $29,705
– Median monthly housing cost: $630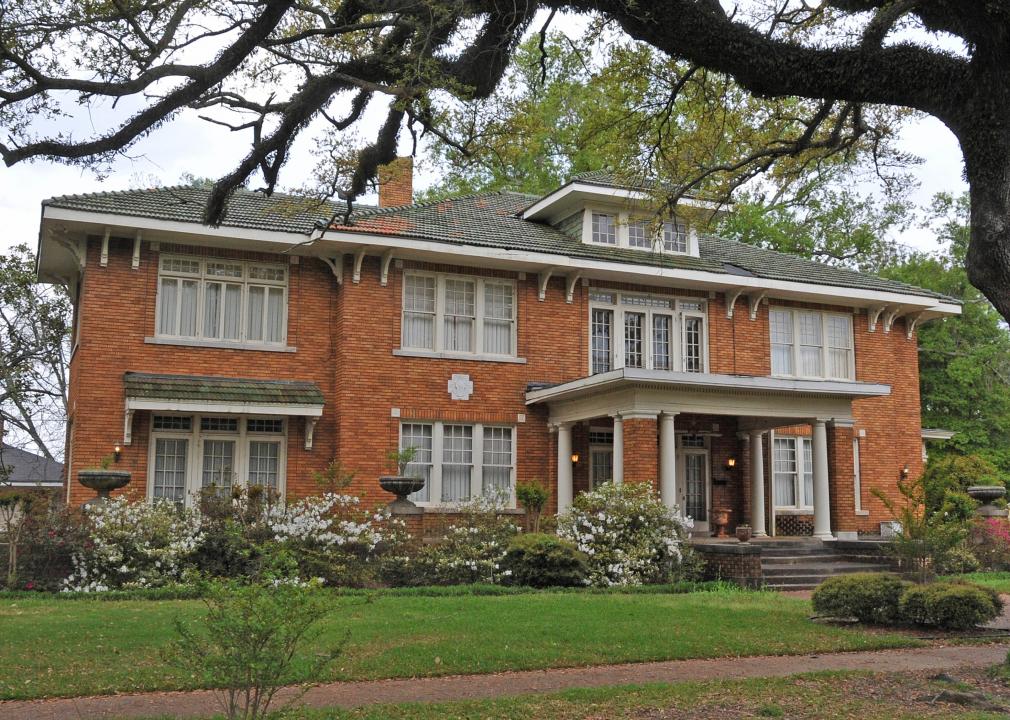
Jerrye & Roy Klotz, MD // Wikimedia Commons
#2. Leflore County
– Median percent of income spent on housing: 26.3%
— Percent of households spending <20% of income on housing: 36.7%
— Percent of households spending >30% of income on housing: 33.2%
– Total occupied households: 9,962
– Median household income: $26,735
– Median monthly housing cost: $585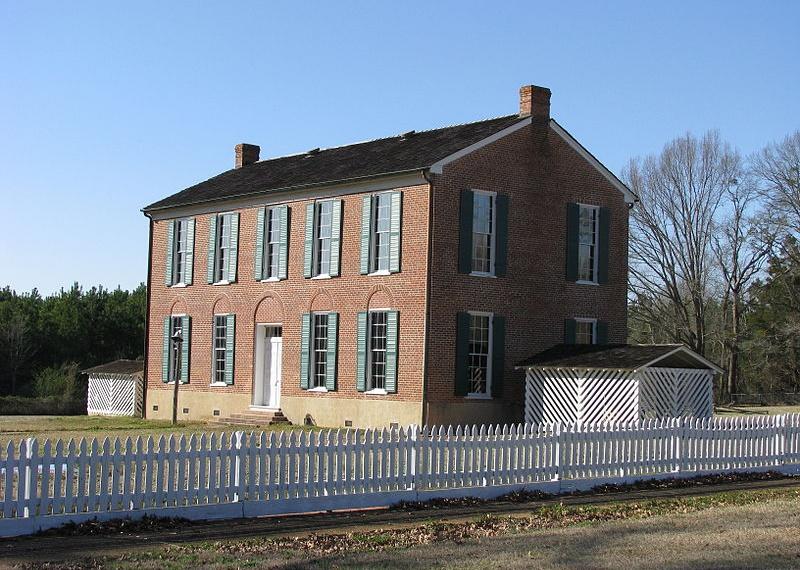
Chillin662 // Wikimedia Commons
#1. Holmes County
– Median percent of income spent on housing: 26.7%
— Percent of households spending <20% of income on housing: 35.1%
— Percent of households spending >30% of income on housing: 31.3%
– Total occupied households: 6,188
– Median household income: $21,504
– Median monthly housing cost: $478
You may also like: Counties with the most super commuters in Mississippi


