
Counties with the lowest hospital bed capacity in Kansas
(STACKER) — The deployment of vaccines beginning in December signaled a turning point in the pandemic. By Feb. 2, more Americans had been vaccinated for COVID-19 than had been infected. But as vaccination rates lagged over the summer, new surges of COVID-19 came. More than 80% of these cases by late July were caused by the Delta variant, which is more contagious than the original virus. This has resulted in growing rates of community transmission and—especially in areas with lower vaccination rates—increasing rates of hospitalization and death.
The United States reached 684,360 COVID-19-related deaths and nearly 42.7 million COVID-19 cases as of Sep. 23, according to Johns Hopkins University.
Currently, 55% of the U.S. population is fully vaccinated. Epidemiologists say the lower the vaccination rate, the more the virus has the opportunity to continue to evolve and become more dangerous.
Stacker compiled a list of the counties with the lowest in-patient bed capacity in Kansas using data from the U.S. Department of Health & Human Services. Counties are ranked by the percent of in-patient hospital beds filled as of Sep. 20, with ICU availability serving as a tiebreaker. Hospitalization data was available for about 77% of counties in the U.S. Keep reading to see what hospital capacity looks like in your county.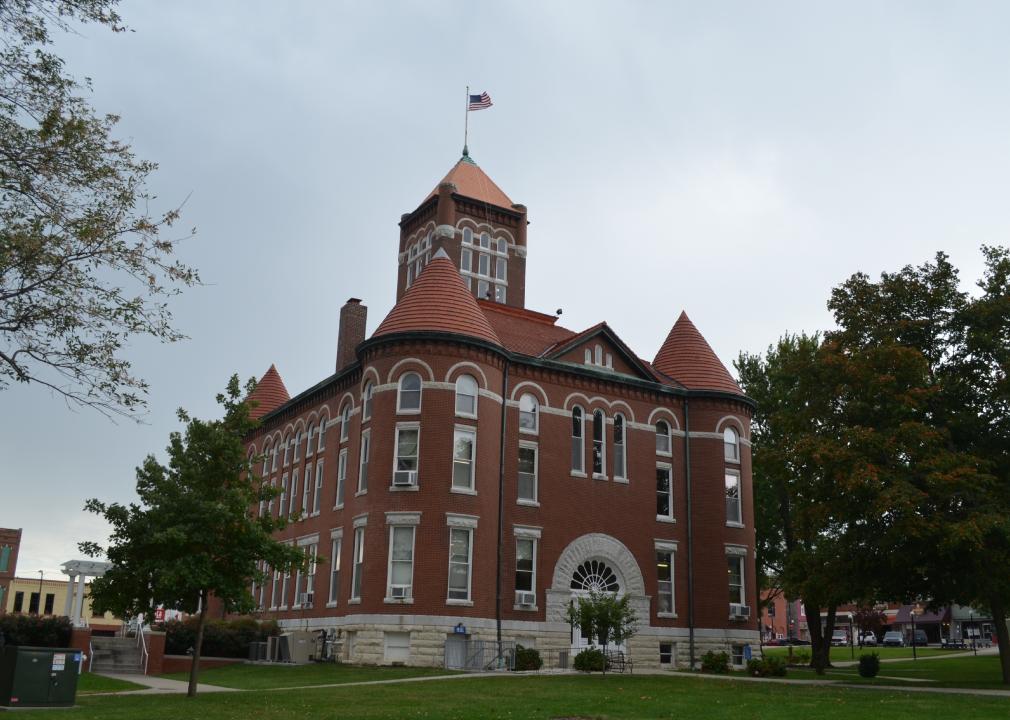
Ichabod // Wikimedia Commons
#50. Anderson County, KS
– Inpatient beds occupied: 38.0% (0.0% by COVID-19 patients)
— 39.7% more availability than Kansas overall
– ICU beds occupied: data not available
— 81% full in Kansas overall
– Cases per 100k in last 7 days: 395 (31 cases)
– Population that is fully vaccinated: 36.7% (2,885 fully vaccinated)
— 27.2% lower vaccination rate than Kansas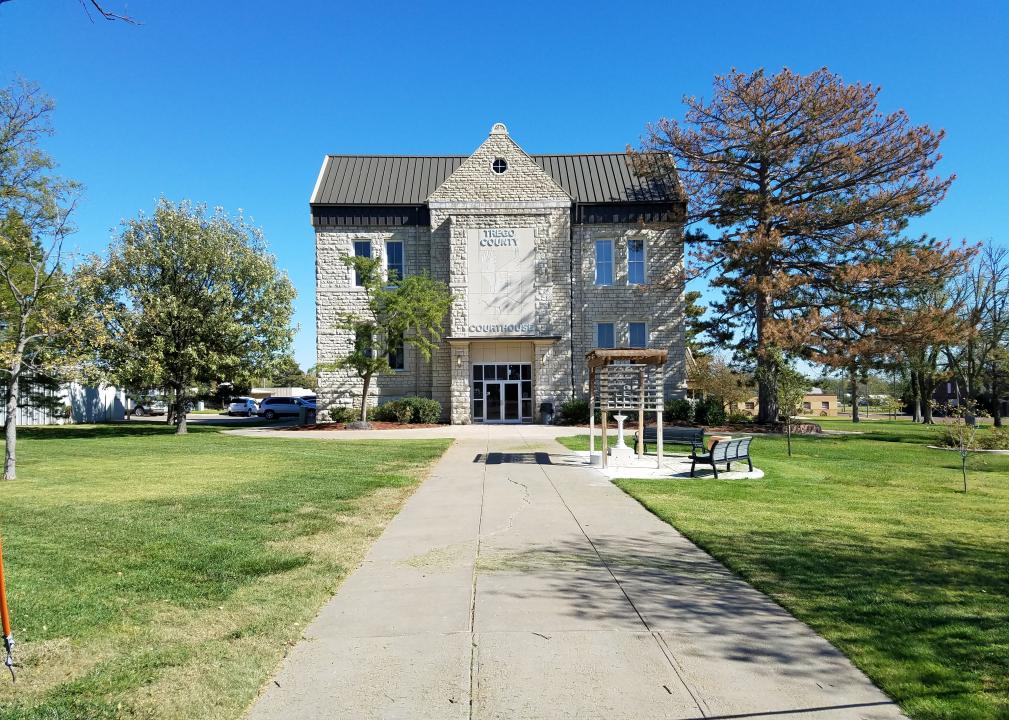
IveGoneAway // Wikimedia Commons
#49. Trego County, KS
– Inpatient beds occupied: 38.0% (0.0% by COVID-19 patients)
— 39.7% more availability than Kansas overall
– ICU beds occupied: data not available
— 81% full in Kansas overall
– Cases per 100k in last 7 days: 214 (6 cases)
– Population that is fully vaccinated: 35.0% (980 fully vaccinated)
— 30.6% lower vaccination rate than Kansas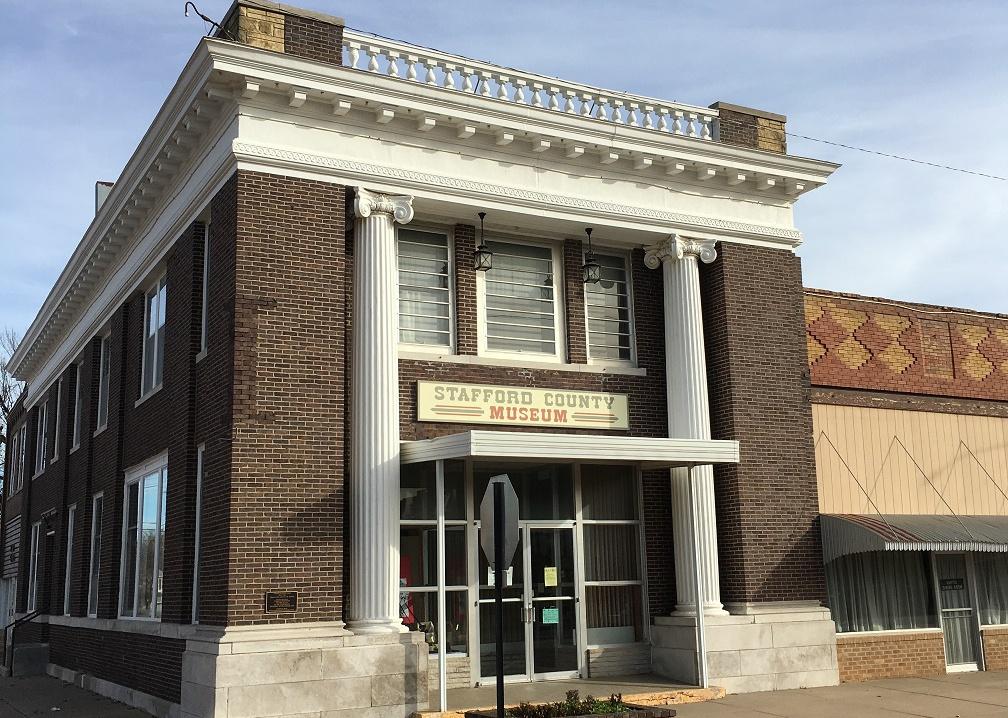
Jon Roanhaus // Wikimedia Commons
#48. Stafford County, KS
– Inpatient beds occupied: 39.0% (0.0% by COVID-19 patients)
— 38.1% more availability than Kansas overall
– ICU beds occupied: data not available
— 81% full in Kansas overall
– Cases per 100k in last 7 days: 842 (35 cases)
– Population that is fully vaccinated: 38.5% (1,602 fully vaccinated)
— 23.6% lower vaccination rate than Kansas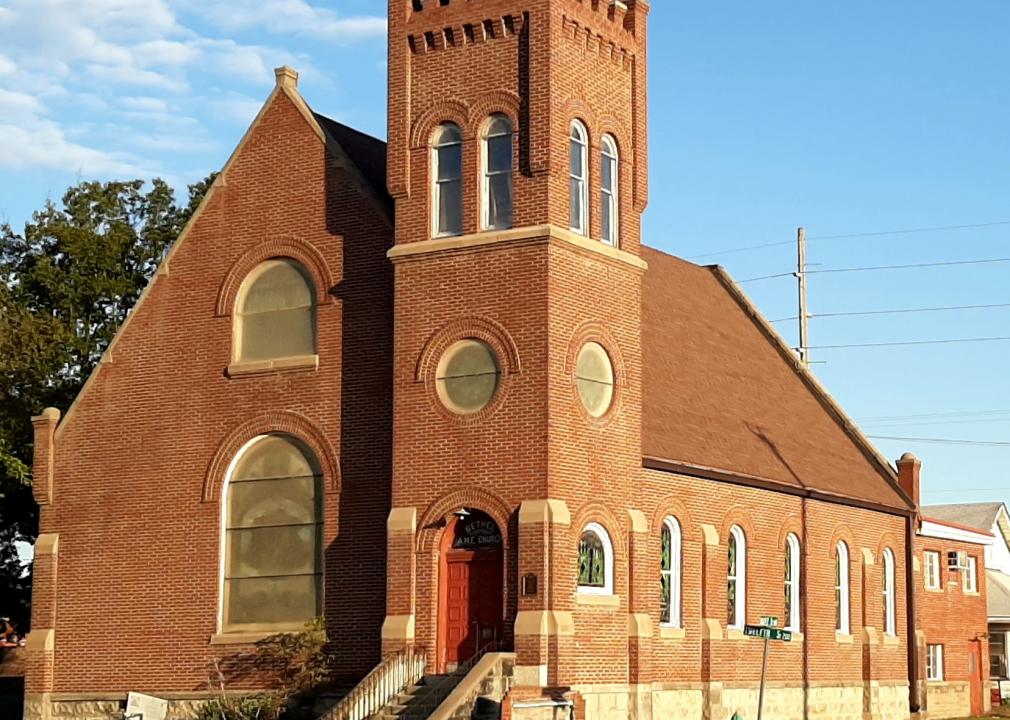
Alishasmith1005 // Wikimedia Commons
#47. Montgomery County, KS
– Inpatient beds occupied: 40.0% (18.0% by COVID-19 patients)
— 36.5% more availability than Kansas overall
– ICU beds occupied: 54.0% (43.0% by COVID-19 patients)
— 33.3% more availability than Kansas overall
– Cases per 100k in last 7 days: 427 (136 cases)
– Population that is fully vaccinated: 38.2% (12,160 fully vaccinated)
— 24.2% lower vaccination rate than Kansas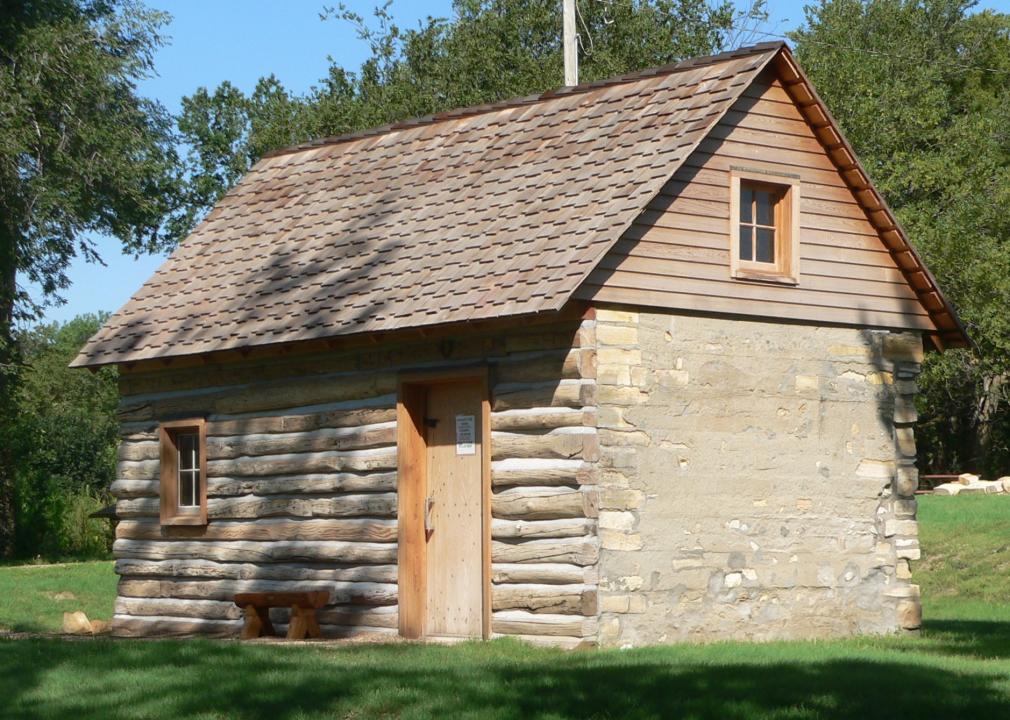
Ammodramus // Wikimedia Commons
#46. Smith County, KS
– Inpatient beds occupied: 40.0% (14.0% by COVID-19 patients)
— 36.5% more availability than Kansas overall
– ICU beds occupied: data not available
— 81% full in Kansas overall
– Cases per 100k in last 7 days: 223 (8 cases)
– Population that is fully vaccinated: 39.8% (1,425 fully vaccinated)
— 21.0% lower vaccination rate than Kansas
Ammodramus // Wikimedia Commons
#45. Thomas County, KS
– Inpatient beds occupied: 41.0% (12.0% by COVID-19 patients)
— 34.9% more availability than Kansas overall
– ICU beds occupied: data not available
— 81% full in Kansas overall
– Cases per 100k in last 7 days: 309 (24 cases)
– Population that is fully vaccinated: 36.1% (2,808 fully vaccinated)
— 28.4% lower vaccination rate than Kansas
Spacini // Wikimedia Commons
#44. Brown County, KS
– Inpatient beds occupied: 44.0% (4.0% by COVID-19 patients)
— 30.2% more availability than Kansas overall
– ICU beds occupied: 100.0% (.0% by COVID-19 patients)
— 23.5% more full than Kansas overall
– Cases per 100k in last 7 days: 146 (14 cases)
– Population that is fully vaccinated: 51.4% (4,918 fully vaccinated)
— 2.0% higher vaccination rate than Kansas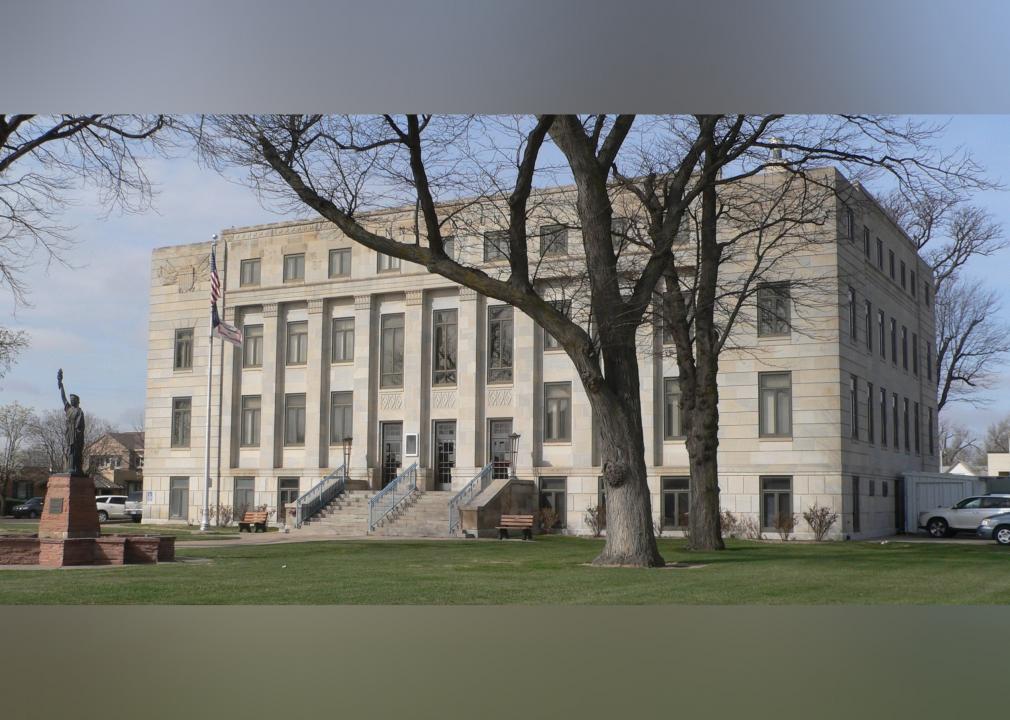
Ammodramus // Wikimedia Commons
#43. Finney County, KS
– Inpatient beds occupied: 45.0% (10.0% by COVID-19 patients)
— 28.6% more availability than Kansas overall
– ICU beds occupied: 54.0% (21.0% by COVID-19 patients)
— 33.3% more availability than Kansas overall
– Cases per 100k in last 7 days: 247 (90 cases)
– Population that is fully vaccinated: 34.4% (12,559 fully vaccinated)
— 31.7% lower vaccination rate than Kansas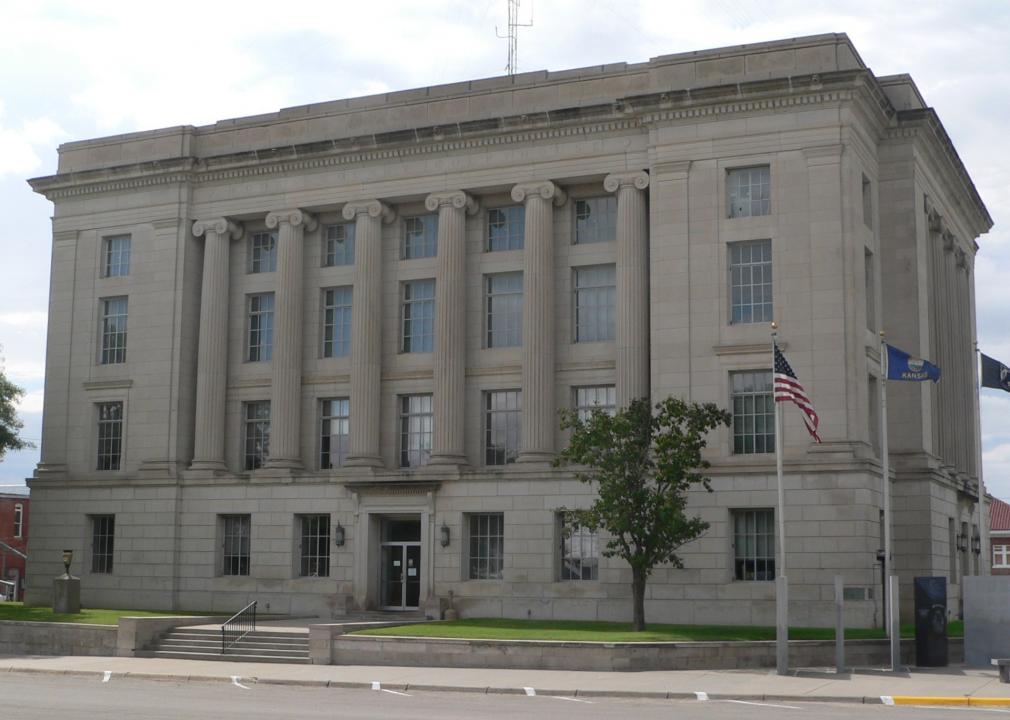
Ammodramus // Wikimedia Commons
#42. Rooks County, KS
– Inpatient beds occupied: 45.0% (5.0% by COVID-19 patients)
— 28.6% more availability than Kansas overall
– ICU beds occupied: data not available
— 81% full in Kansas overall
– Cases per 100k in last 7 days: 285 (14 cases)
– Population that is fully vaccinated: 41.6% (2,046 fully vaccinated)
— 17.5% lower vaccination rate than Kansas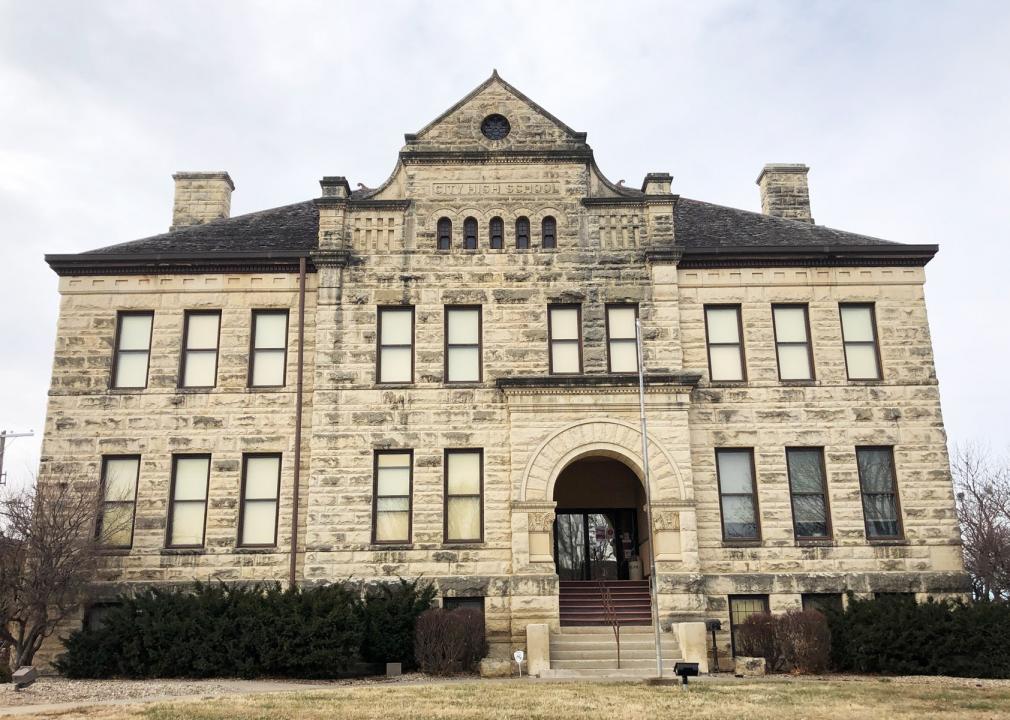
SharonPapierdreams // Wikimedia Commons
#41. Geary County, KS
– Inpatient beds occupied: 47.0% (7.0% by COVID-19 patients)
— 25.4% more availability than Kansas overall
– ICU beds occupied: 81.0% (33.0% by COVID-19 patients)
— 0.0% more availability than Kansas overall
– Cases per 100k in last 7 days: 202 (64 cases)
– Population that is fully vaccinated: 54.3% (17,204 fully vaccinated)
— 7.7% higher vaccination rate than Kansas
JonHarder // Wikimedia Commons
#40. Harvey County, KS
– Inpatient beds occupied: 48.0% (0.0% by COVID-19 patients)
— 23.8% more availability than Kansas overall
– ICU beds occupied: 95.0% (.0% by COVID-19 patients)
— 17.3% more full than Kansas overall
– Cases per 100k in last 7 days: 328 (113 cases)
– Population that is fully vaccinated: 39.0% (13,433 fully vaccinated)
— 22.6% lower vaccination rate than Kansas
Shamera // Wikimedia Commons
#39. Coffey County, KS
– Inpatient beds occupied: 48.0% (25.0% by COVID-19 patients)
— 23.8% more availability than Kansas overall
– ICU beds occupied: data not available
— 81% full in Kansas overall
– Cases per 100k in last 7 days: 685 (56 cases)
– Population that is fully vaccinated: 44.0% (3,596 fully vaccinated)
— 12.7% lower vaccination rate than Kansas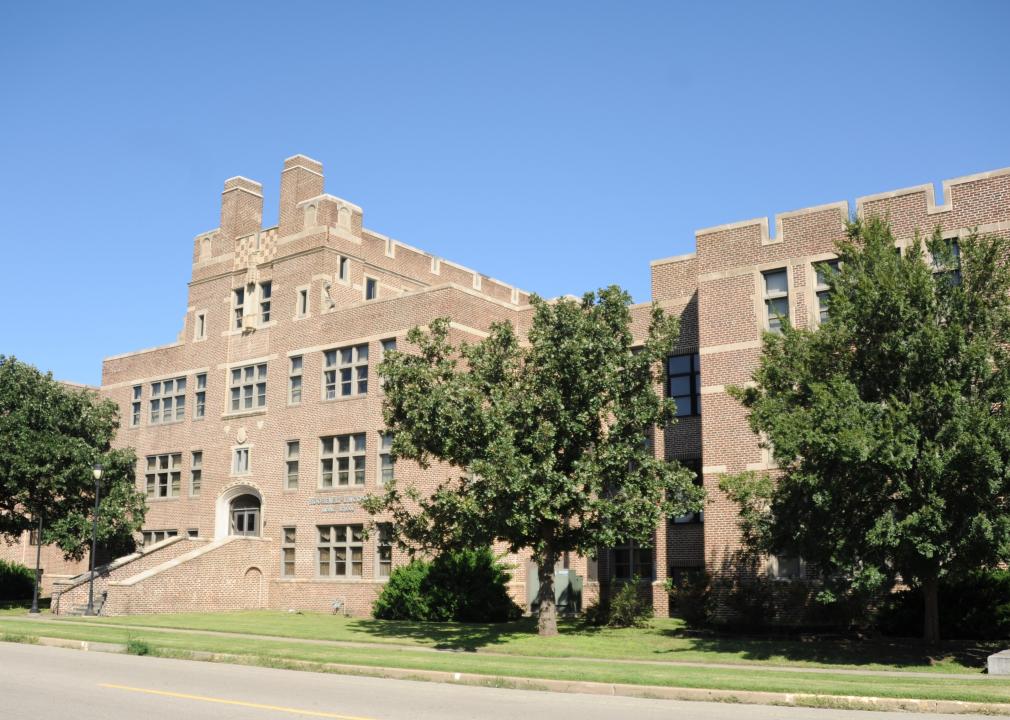
Keith Snyder // Wikimedia Commons
#38. Saline County, KS
– Inpatient beds occupied: 50.0% (8.0% by COVID-19 patients)
— 20.6% more availability than Kansas overall
– ICU beds occupied: 70.0% (39.0% by COVID-19 patients)
— 13.6% more availability than Kansas overall
– Cases per 100k in last 7 days: 301 (163 cases)
– Population that is fully vaccinated: 42.2% (22,865 fully vaccinated)
— 16.3% lower vaccination rate than Kansas
Lane Pearman // Wikimedia Commons
#37. Kiowa County, KS
– Inpatient beds occupied: 50.0% (11.0% by COVID-19 patients)
— 20.6% more availability than Kansas overall
– ICU beds occupied: data not available
— 81% full in Kansas overall
– Cases per 100k in last 7 days: 283 (7 cases)
– Population that is fully vaccinated: 43.1% (1,066 fully vaccinated)
— 14.5% lower vaccination rate than Kansas
Pittsburgstealer // Wikimedia Commons
#36. Crawford County, KS
– Inpatient beds occupied: 51.0% (7.0% by COVID-19 patients)
— 19.0% more availability than Kansas overall
– ICU beds occupied: 69.0% (26.0% by COVID-19 patients)
— 14.8% more availability than Kansas overall
– Cases per 100k in last 7 days: 165 (64 cases)
– Population that is fully vaccinated: 41.1% (15,963 fully vaccinated)
— 18.5% lower vaccination rate than Kansas
Jon Barker // Wikimedia Commons
#35. Jackson County, KS
– Inpatient beds occupied: 51.0% (14.0% by COVID-19 patients)
— 19.0% more availability than Kansas overall
– ICU beds occupied: data not available
— 81% full in Kansas overall
– Cases per 100k in last 7 days: 197 (26 cases)
– Population that is fully vaccinated: 55.0% (7,245 fully vaccinated)
— 9.1% higher vaccination rate than Kansas
Ammodramus // Wikimedia Commons
#34. Decatur County, KS
– Inpatient beds occupied: 52.0% (8.0% by COVID-19 patients)
— 17.5% more availability than Kansas overall
– ICU beds occupied: data not available
— 81% full in Kansas overall
– Cases per 100k in last 7 days: 106 (3 cases)
– Population that is fully vaccinated: 34.9% (987 fully vaccinated)
— 30.8% lower vaccination rate than Kansas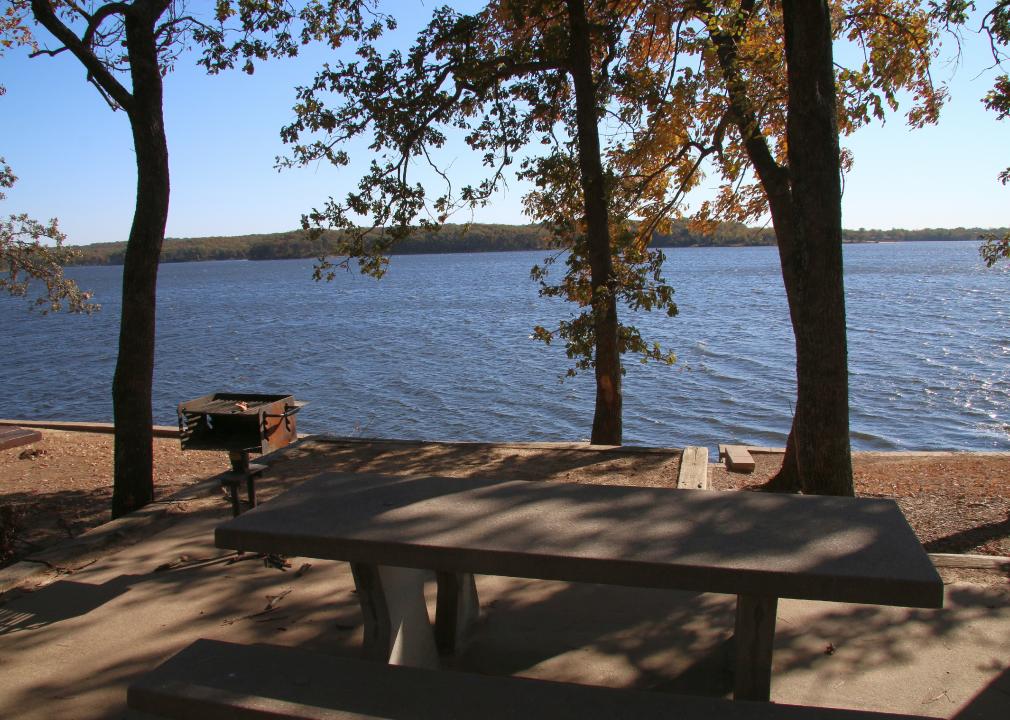
usacetulsa // Wikimedia Commons
#33. Labette County, KS
– Inpatient beds occupied: 53.0% (5.0% by COVID-19 patients)
— 15.9% more availability than Kansas overall
– ICU beds occupied: 51.0% (3.0% by COVID-19 patients)
— 37.0% more availability than Kansas overall
– Cases per 100k in last 7 days: 173 (34 cases)
– Population that is fully vaccinated: 43.0% (8,429 fully vaccinated)
— 14.7% lower vaccination rate than Kansas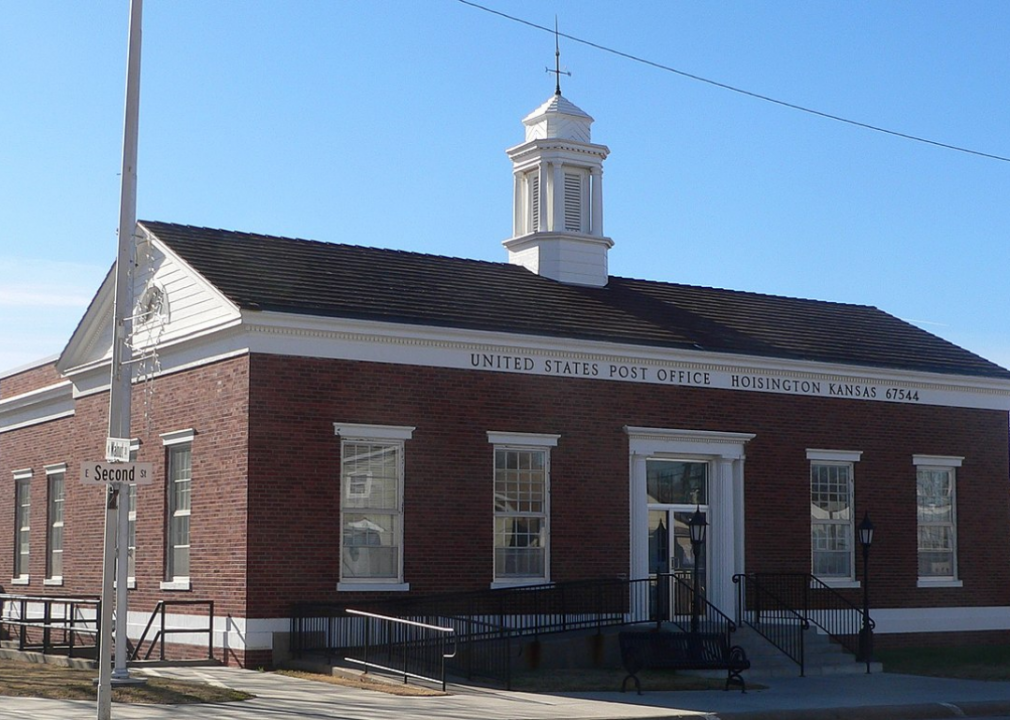
Ammodramus // Wikimedia Commons
#32. Barton County, KS
– Inpatient beds occupied: 53.0% (4.0% by COVID-19 patients)
— 15.9% more availability than Kansas overall
– ICU beds occupied: data not available
— 81% full in Kansas overall
– Cases per 100k in last 7 days: 566 (146 cases)
– Population that is fully vaccinated: 36.5% (9,398 fully vaccinated)
— 27.6% lower vaccination rate than Kansas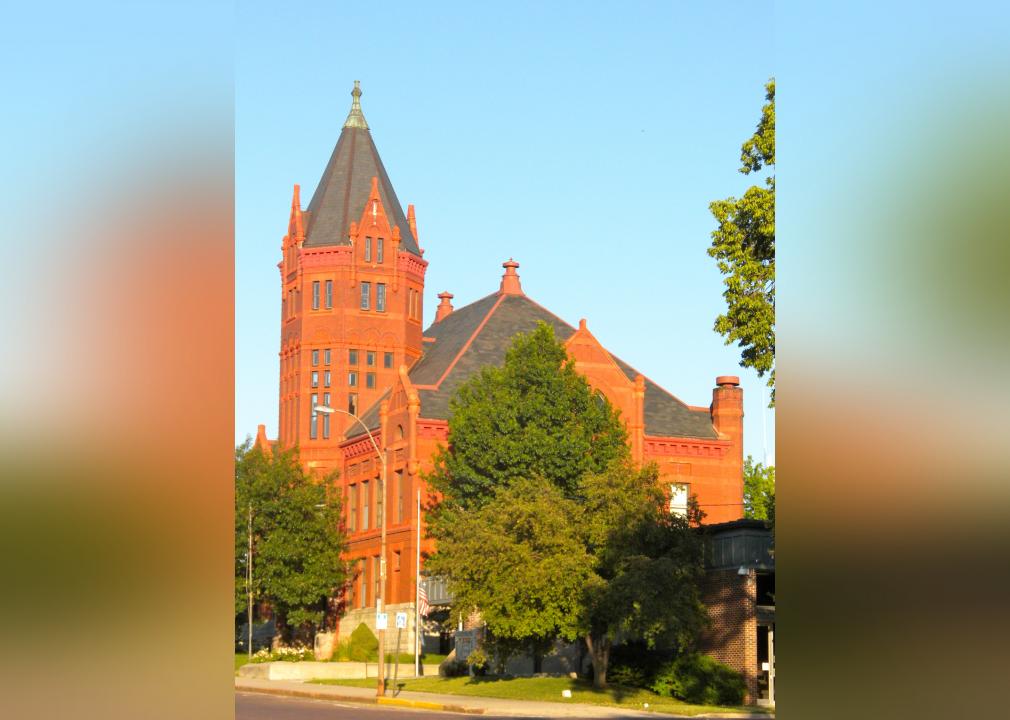
Smallbones // Wikimedia Commons
#31. Marshall County, KS
– Inpatient beds occupied: 53.0% (9.0% by COVID-19 patients)
— 15.9% more availability than Kansas overall
– ICU beds occupied: data not available
— 81% full in Kansas overall
– Cases per 100k in last 7 days: 206 (20 cases)
– Population that is fully vaccinated: 54.7% (5,311 fully vaccinated)
— 8.5% higher vaccination rate than Kansas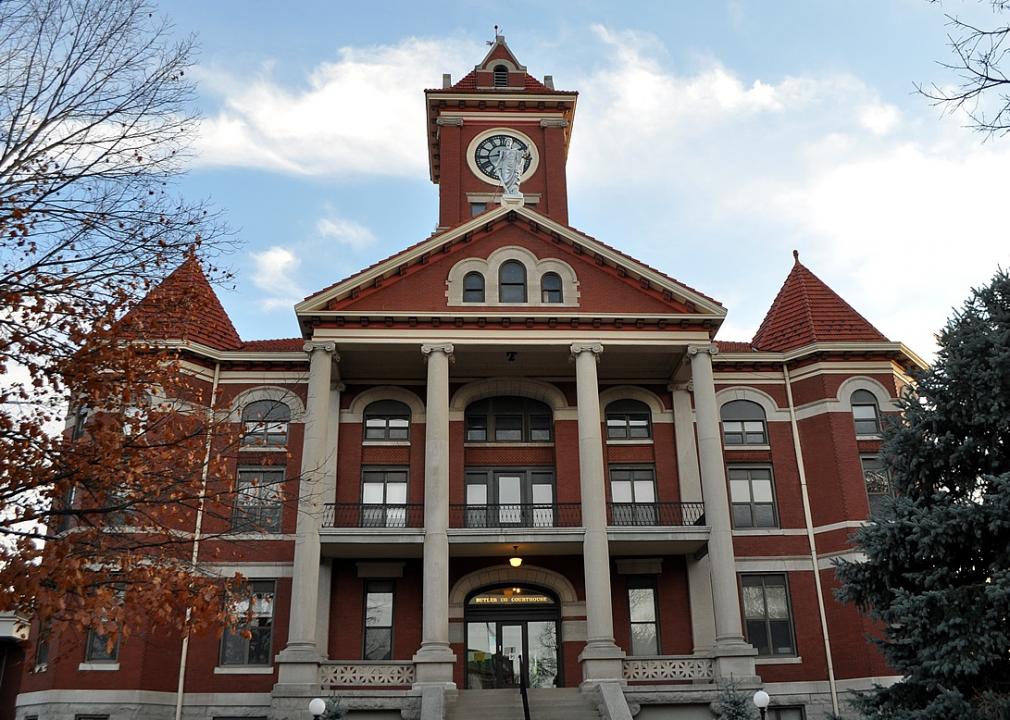
MadameGraffigny // Wikimedia Commons
#30. Butler County, KS
– Inpatient beds occupied: 54.0% (5.0% by COVID-19 patients)
— 14.3% more availability than Kansas overall
– ICU beds occupied: 42.0% (6.0% by COVID-19 patients)
— 48.1% more availability than Kansas overall
– Cases per 100k in last 7 days: 490 (328 cases)
– Population that is fully vaccinated: 39.6% (26,497 fully vaccinated)
— 21.4% lower vaccination rate than Kansas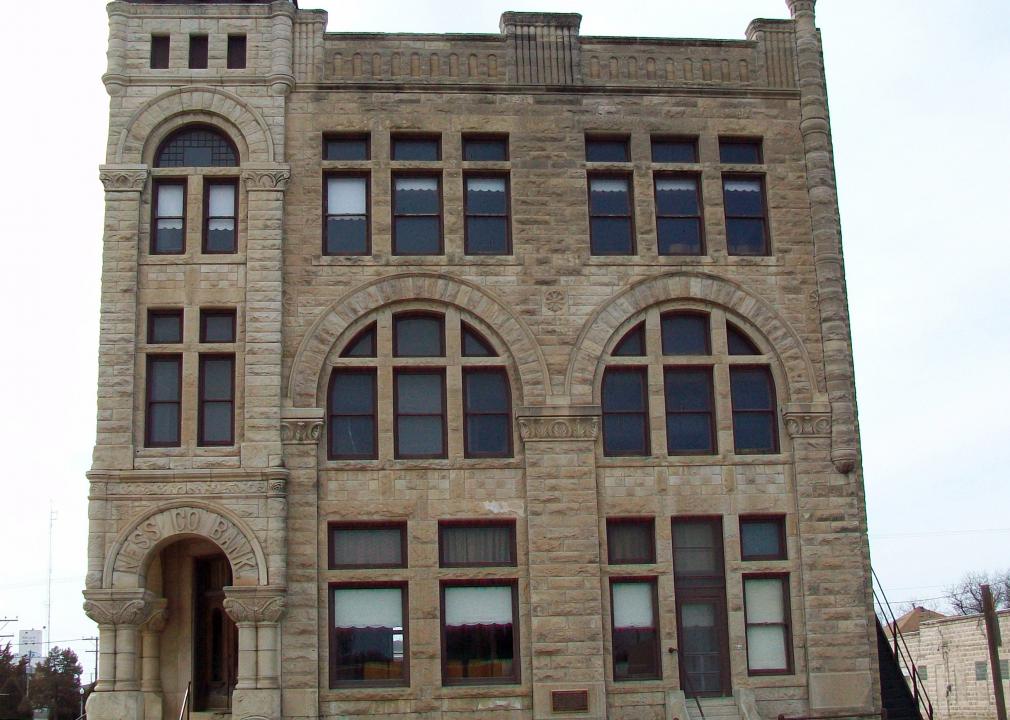
Catlady95 // Wikimedia Commons
#29. Ness County, KS
– Inpatient beds occupied: 56.0% (0.0% by COVID-19 patients)
— 11.1% more availability than Kansas overall
– ICU beds occupied: data not available
— 81% full in Kansas overall
– Cases per 100k in last 7 days: 509 (14 cases)
– Population that is fully vaccinated: 44.2% (1,216 fully vaccinated)
— 12.3% lower vaccination rate than Kansas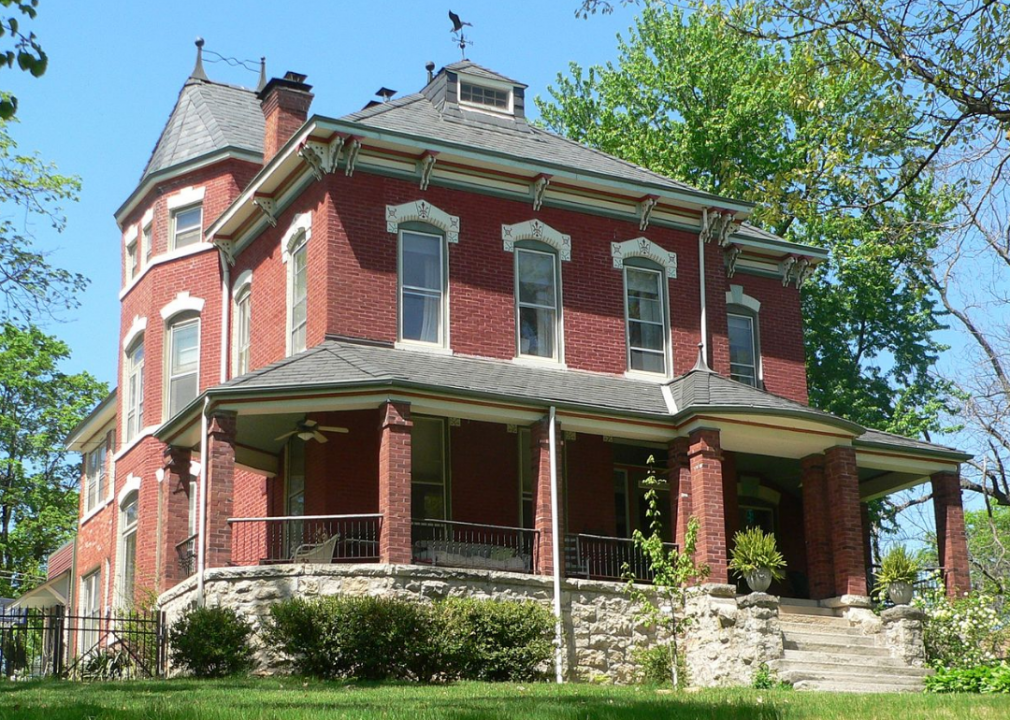
Ammodramus // Wikimedia Commons
#28. Atchison County, KS
– Inpatient beds occupied: 57.0% (10.0% by COVID-19 patients)
— 9.5% more availability than Kansas overall
– ICU beds occupied: 29.0% (21.0% by COVID-19 patients)
— 64.2% more availability than Kansas overall
– Cases per 100k in last 7 days: 305 (49 cases)
– Population that is fully vaccinated: 38.0% (6,114 fully vaccinated)
— 24.6% lower vaccination rate than Kansas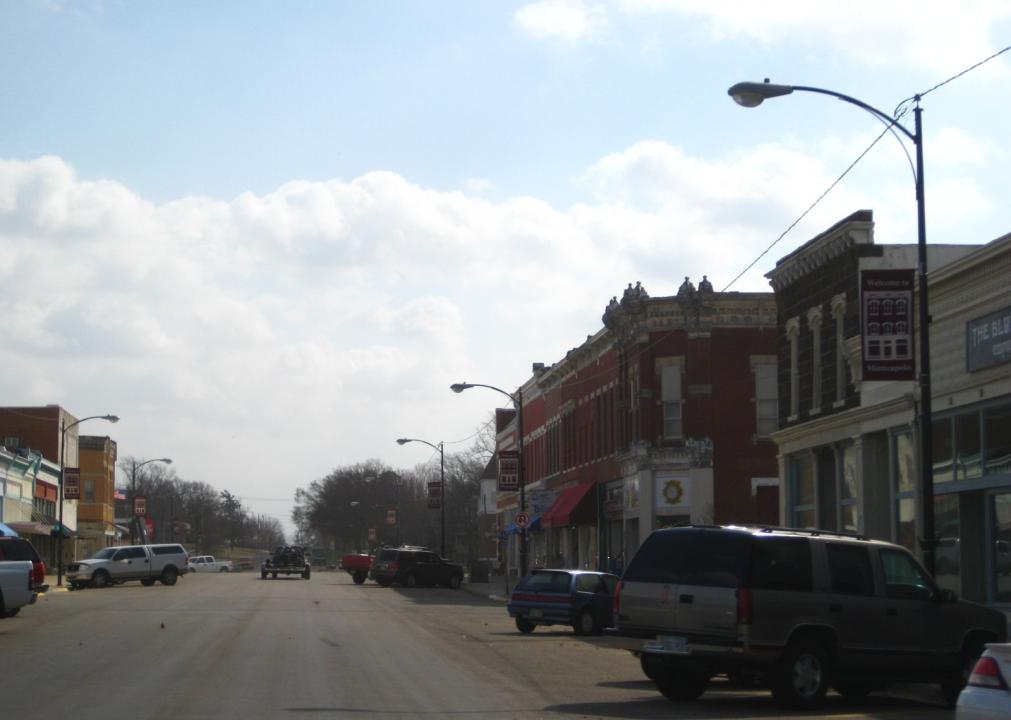
shannonpatric17 // Wikimedia Commons
#27. Ottawa County, KS
– Inpatient beds occupied: 57.0% (0.0% by COVID-19 patients)
— 9.5% more availability than Kansas overall
– ICU beds occupied: data not available
— 81% full in Kansas overall
– Cases per 100k in last 7 days: 263 (15 cases)
– Population that is fully vaccinated: 35.1% (2,000 fully vaccinated)
— 30.4% lower vaccination rate than Kansas
Kzollman // Wikimedia Commons
#26. Riley County, KS
– Inpatient beds occupied: 58.0% (7.0% by COVID-19 patients)
— 7.9% more availability than Kansas overall
– ICU beds occupied: 49.0% (11.0% by COVID-19 patients)
— 39.5% more availability than Kansas overall
– Cases per 100k in last 7 days: 294 (218 cases)
– Population that is fully vaccinated: 32.9% (24,453 fully vaccinated)
— 34.7% lower vaccination rate than Kansas
Ammodramus // Wikimedia Commons
#25. Barber County, KS
– Inpatient beds occupied: 58.0% (2.0% by COVID-19 patients)
— 7.9% more availability than Kansas overall
– ICU beds occupied: data not available
— 81% full in Kansas overall
– Cases per 100k in last 7 days: 203 (9 cases)
– Population that is fully vaccinated: 40.5% (1,792 fully vaccinated)
— 19.6% lower vaccination rate than Kansas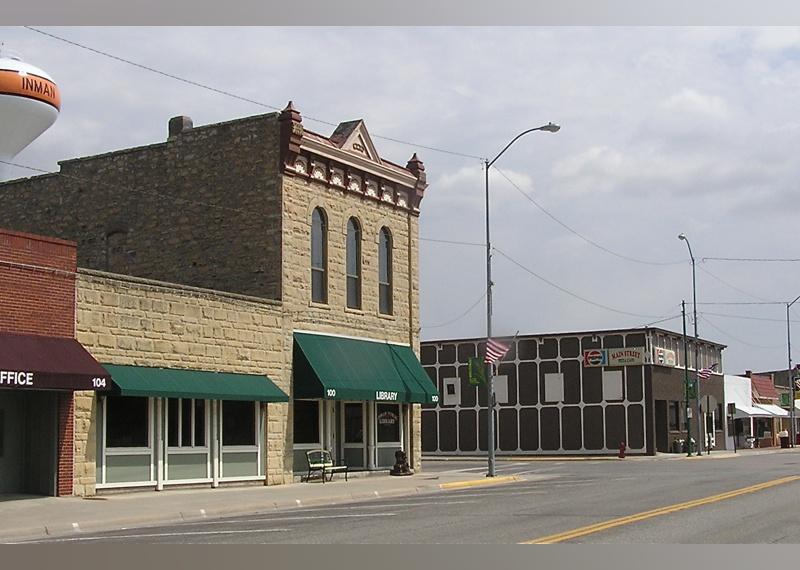
Mark Michalovic // Wikimedia Commons
#24. McPherson County, KS
– Inpatient beds occupied: 60.0% (5.0% by COVID-19 patients)
— 4.8% more availability than Kansas overall
– ICU beds occupied: 27.0% (14.0% by COVID-19 patients)
— 66.7% more availability than Kansas overall
– Cases per 100k in last 7 days: 354 (101 cases)
– Population that is fully vaccinated: 46.2% (13,195 fully vaccinated)
— 8.3% lower vaccination rate than Kansas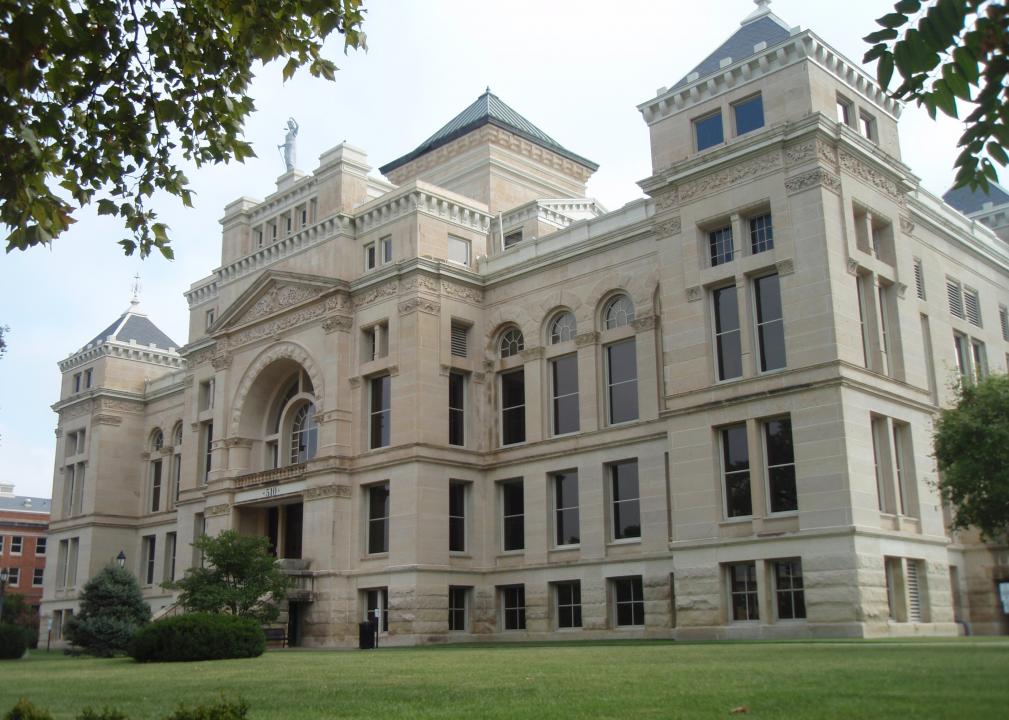
Ichabod // Wikimedia Commons
#23. Sedgwick County, KS
– Inpatient beds occupied: 62.0% (8.0% by COVID-19 patients)
— 1.6% more availability than Kansas overall
– ICU beds occupied: 91.0% (23.0% by COVID-19 patients)
— 12.3% more full than Kansas overall
– Cases per 100k in last 7 days: 454 (2,342 cases)
– Population that is fully vaccinated: 42.4% (218,735 fully vaccinated)
— 15.9% lower vaccination rate than Kansas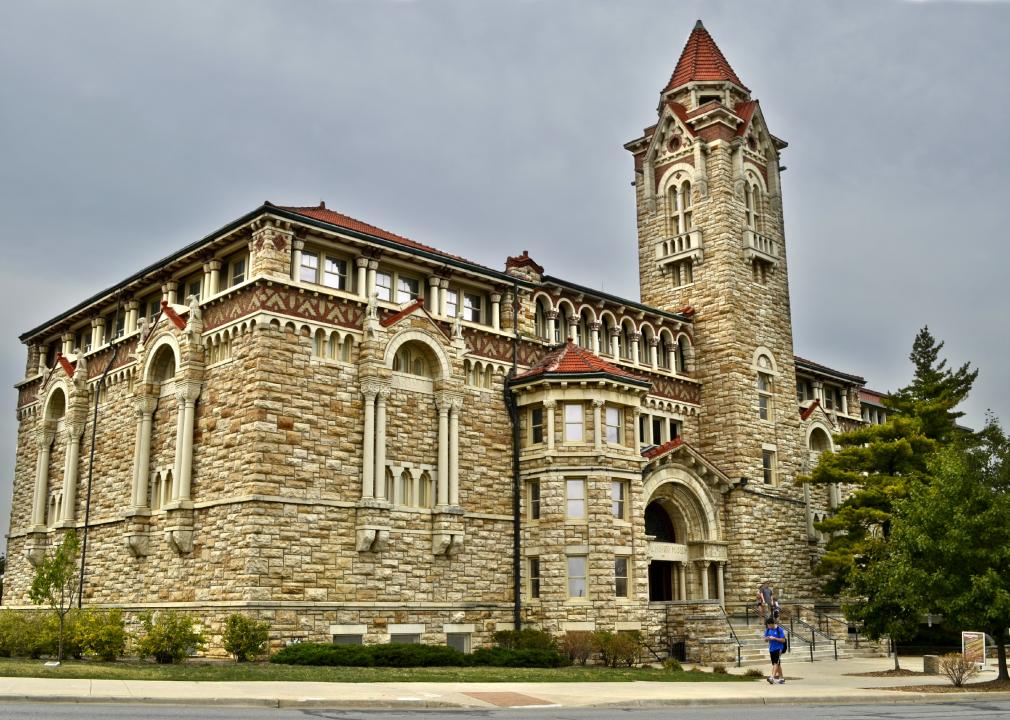
Ajohnson360 // Wikimedia Commons
#22. Douglas County, KS
– Inpatient beds occupied: 63.0% (11.0% by COVID-19 patients)
— 0.0% more availability than Kansas overall
– ICU beds occupied: 89.0% (30.0% by COVID-19 patients)
— 9.9% more full than Kansas overall
– Cases per 100k in last 7 days: 194 (237 cases)
– Population that is fully vaccinated: 53.1% (64,880 fully vaccinated)
— 5.4% higher vaccination rate than Kansas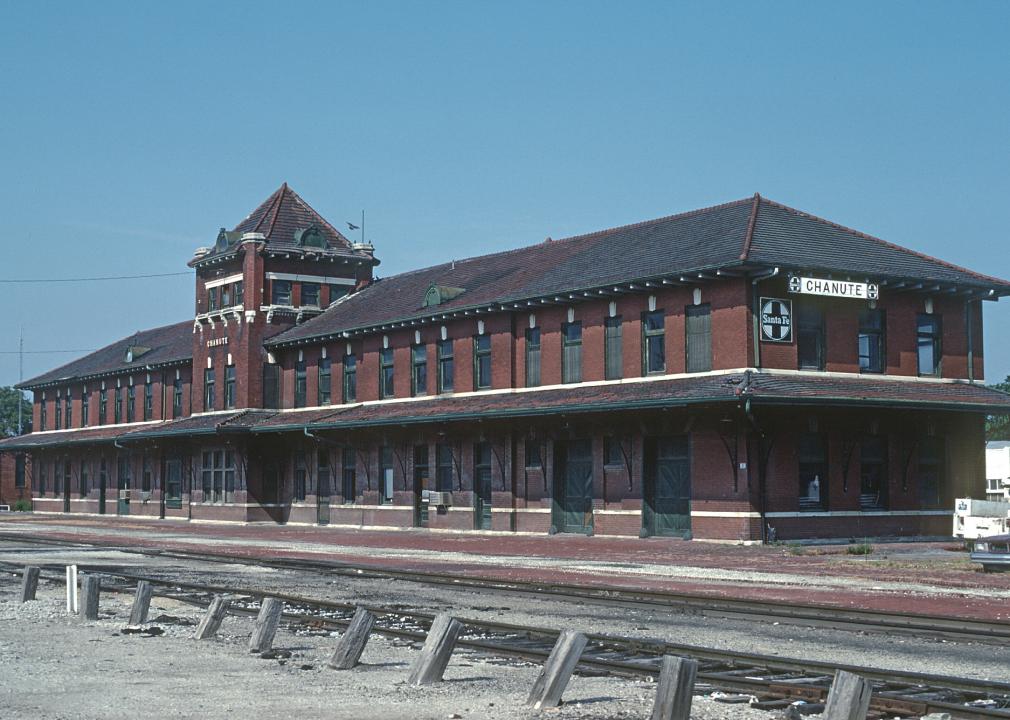
railfan 44 // Wikimedia Commons
#21. Neosho County, KS
– Inpatient beds occupied: 66.0% (10.0% by COVID-19 patients)
— 4.8% more full than Kansas overall
– ICU beds occupied: 74.0% (31.0% by COVID-19 patients)
— 8.6% more availability than Kansas overall
– Cases per 100k in last 7 days: 312 (50 cases)
– Population that is fully vaccinated: 22.1% (3,537 fully vaccinated)
— 56.2% lower vaccination rate than Kansas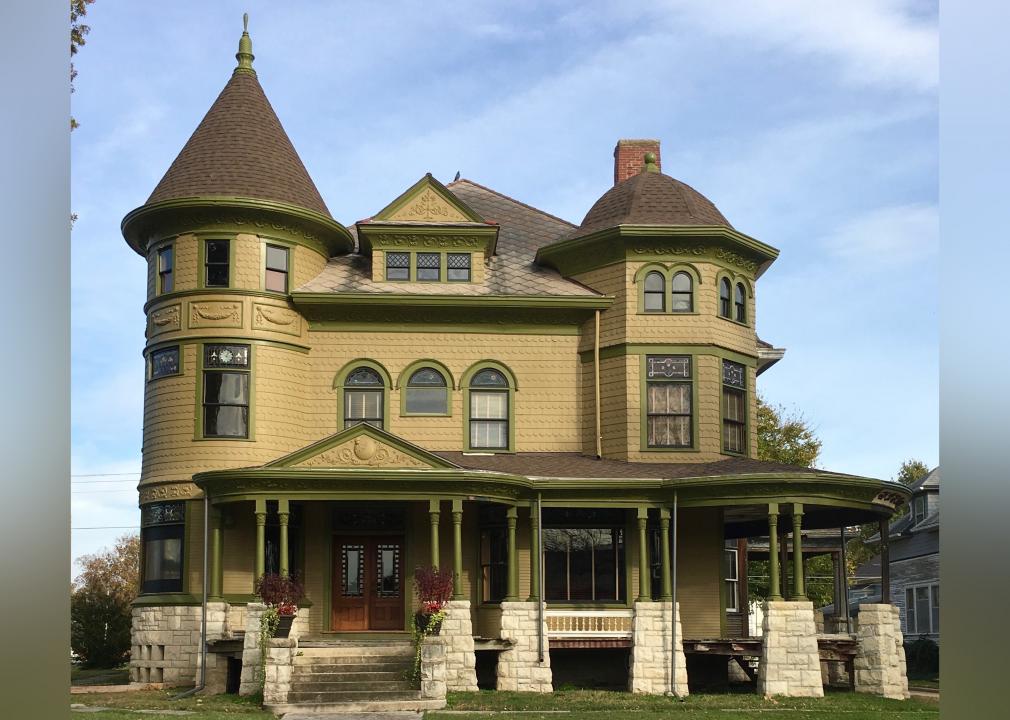
Macross24 // Wikimedia Commons
#20. Lyon County, KS
– Inpatient beds occupied: 67.0% (12.0% by COVID-19 patients)
— 6.3% more full than Kansas overall
– ICU beds occupied: 29.0% (14.0% by COVID-19 patients)
— 64.2% more availability than Kansas overall
– Cases per 100k in last 7 days: 328 (109 cases)
– Population that is fully vaccinated: 48.7% (16,165 fully vaccinated)
— 3.4% lower vaccination rate than Kansas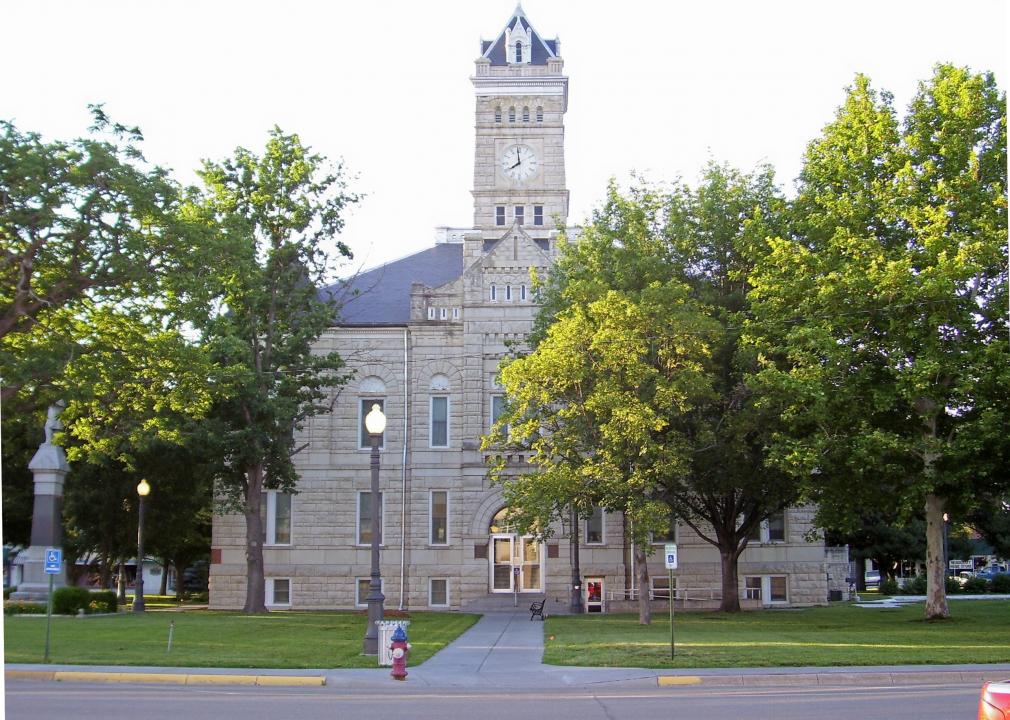
Clay County Commissioners // Wikimedia Commons
#19. Clay County, KS
– Inpatient beds occupied: 67.0% (6.0% by COVID-19 patients)
— 6.3% more full than Kansas overall
– ICU beds occupied: data not available
— 81% full in Kansas overall
– Cases per 100k in last 7 days: 575 (46 cases)
– Population that is fully vaccinated: 49.1% (3,931 fully vaccinated)
— 2.6% lower vaccination rate than Kansas
Ammodramus // Wikimedia Commons
#18. Ford County, KS
– Inpatient beds occupied: 68.0% (14.0% by COVID-19 patients)
— 7.9% more full than Kansas overall
– ICU beds occupied: 81.0% (44.0% by COVID-19 patients)
— 0.0% more availability than Kansas overall
– Cases per 100k in last 7 days: 238 (80 cases)
– Population that is fully vaccinated: 35.0% (11,755 fully vaccinated)
— 30.6% lower vaccination rate than Kansas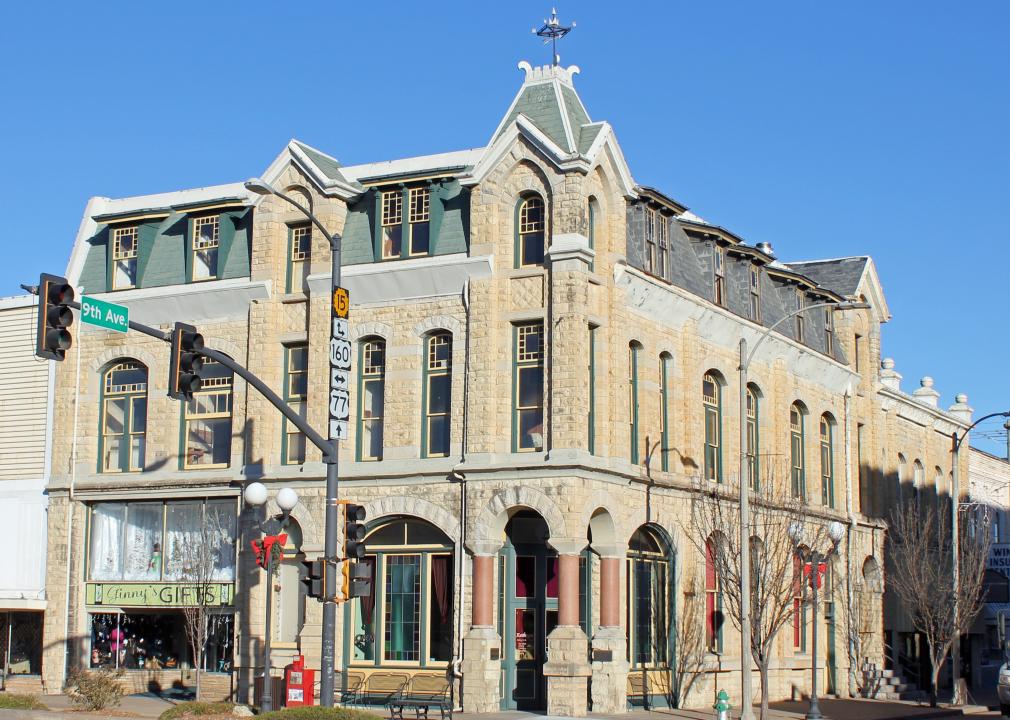
Jeffrey Beall // Wikimedia Commons
#17. Cowley County, KS
– Inpatient beds occupied: 69.0% (6.0% by COVID-19 patients)
— 9.5% more full than Kansas overall
– ICU beds occupied: .0% (.0% by COVID-19 patients)
— 100.0% more availability than Kansas overall
– Cases per 100k in last 7 days: 427 (149 cases)
– Population that is fully vaccinated: 40.4% (14,111 fully vaccinated)
— 19.8% lower vaccination rate than Kansas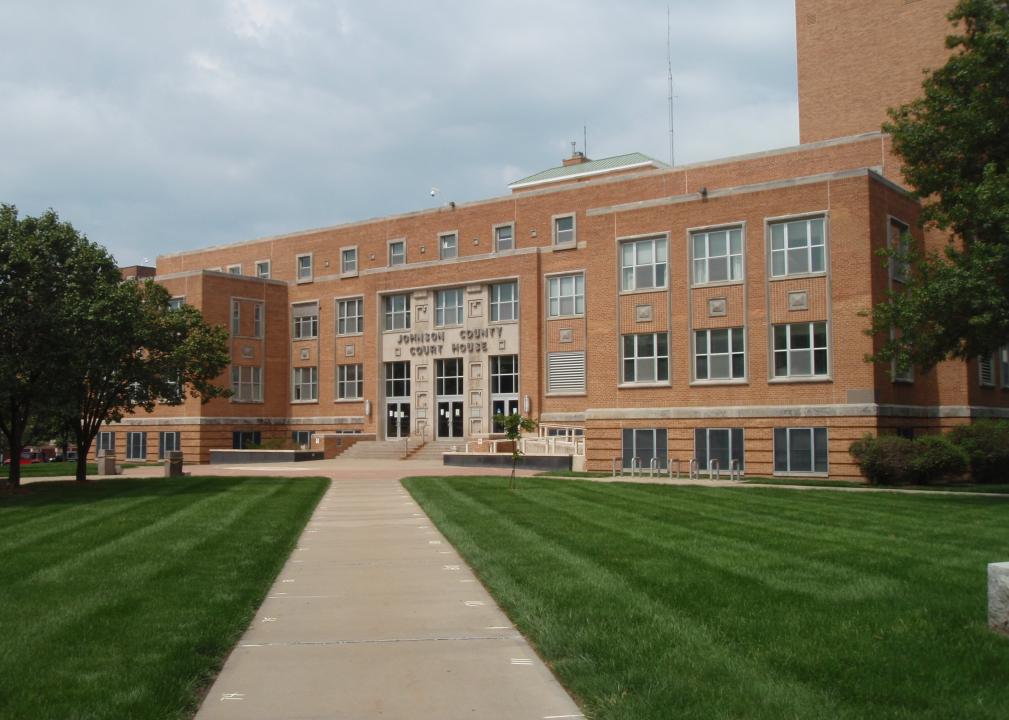
Ichabod // Wikimedia Commons
#16. Johnson County, KS
– Inpatient beds occupied: 69.0% (7.0% by COVID-19 patients)
— 9.5% more full than Kansas overall
– ICU beds occupied: 80.0% (23.0% by COVID-19 patients)
— 1.2% more availability than Kansas overall
– Cases per 100k in last 7 days: 236 (1,419 cases)
– Population that is fully vaccinated: 63.0% (379,557 fully vaccinated)
— 25.0% higher vaccination rate than Kansas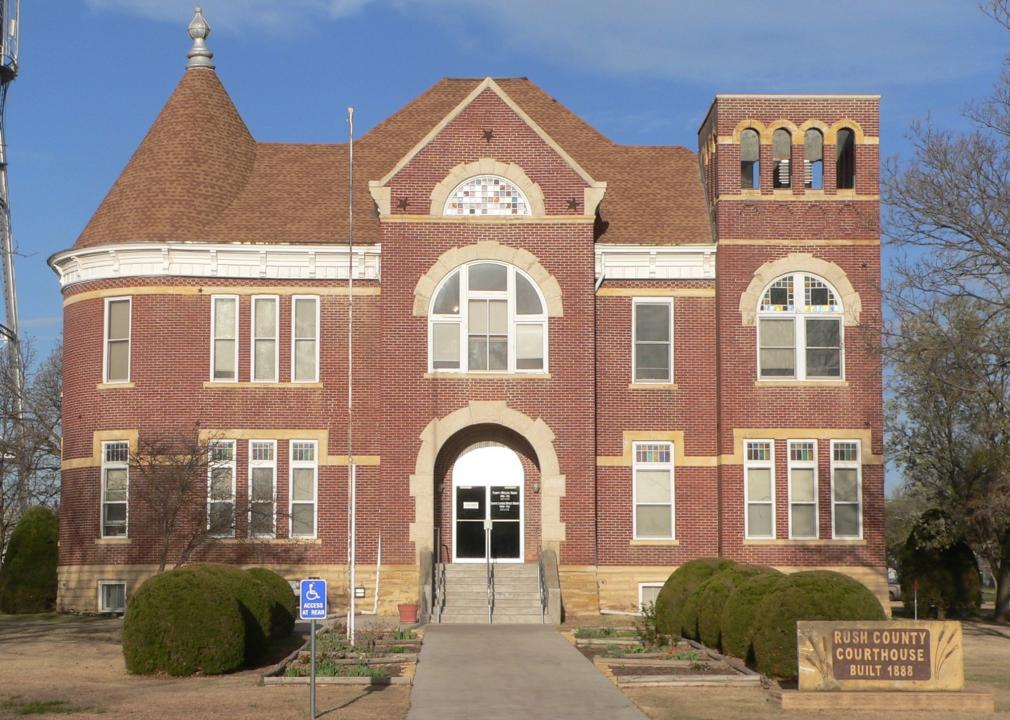
Ammodramus // Wikimedia Commons
#15. Rush County, KS
– Inpatient beds occupied: 70.0% (4.0% by COVID-19 patients)
— 11.1% more full than Kansas overall
– ICU beds occupied: data not available
— 81% full in Kansas overall
– Cases per 100k in last 7 days: 231 (7 cases)
– Population that is fully vaccinated: 44.1% (1,338 fully vaccinated)
— 12.5% lower vaccination rate than Kansas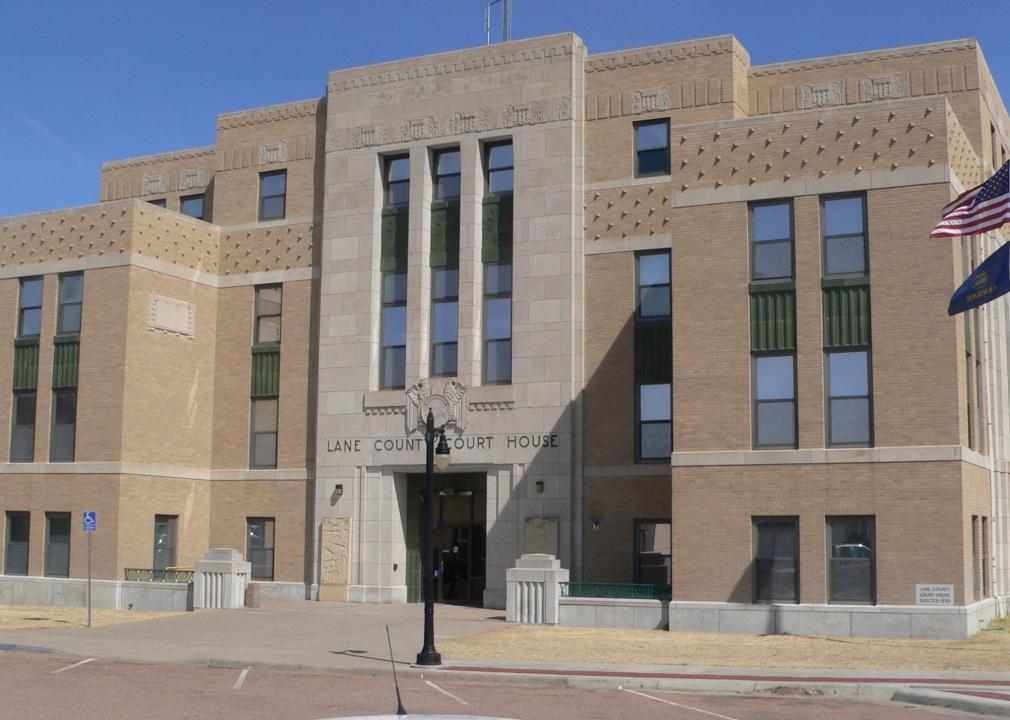
Ammodramus // Wikimedia Commons
#14. Lane County, KS
– Inpatient beds occupied: 71.0% (0.0% by COVID-19 patients)
— 12.7% more full than Kansas overall
– ICU beds occupied: data not available
— 81% full in Kansas overall
– Cases per 100k in last 7 days: 65 (1 cases)
– Population that is fully vaccinated: 37.1% (569 fully vaccinated)
— 26.4% lower vaccination rate than Kansas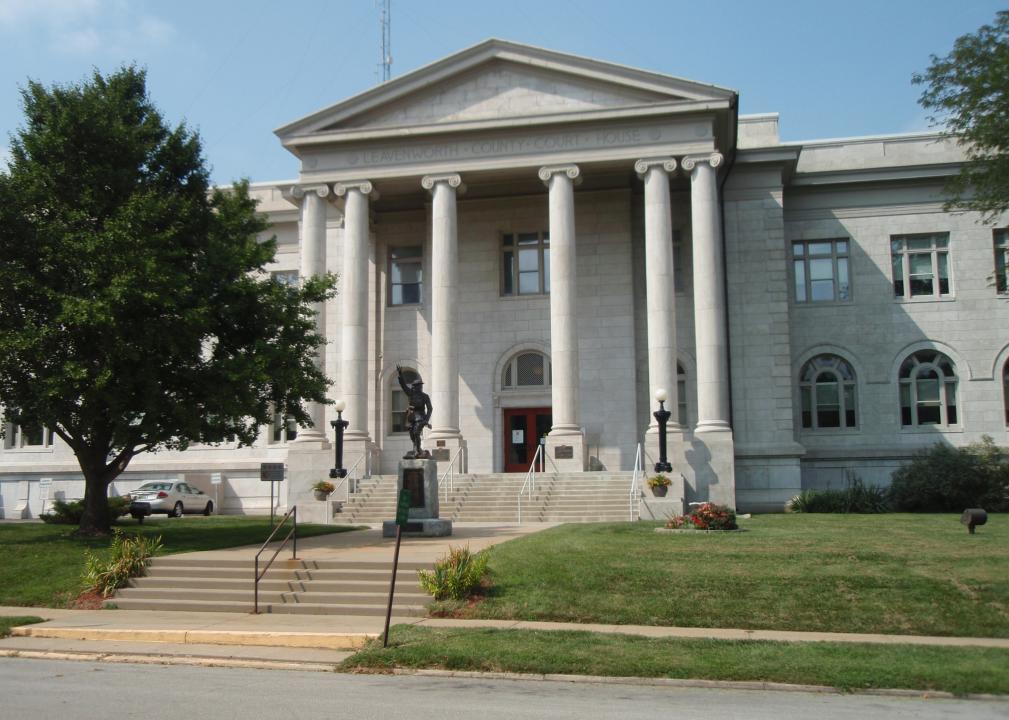
Ichabod // Wikimedia Commons
#13. Leavenworth County, KS
– Inpatient beds occupied: 72.0% (5.0% by COVID-19 patients)
— 14.3% more full than Kansas overall
– ICU beds occupied: 53.0% (17.0% by COVID-19 patients)
— 34.6% more availability than Kansas overall
– Cases per 100k in last 7 days: 243 (199 cases)
– Population that is fully vaccinated: 51.1% (41,751 fully vaccinated)
— 1.4% higher vaccination rate than Kansas
Billy Hathorn // Wikimedia Commons
#12. Hamilton County, KS
– Inpatient beds occupied: 76.0% (0.0% by COVID-19 patients)
— 20.6% more full than Kansas overall
– ICU beds occupied: data not available
— 81% full in Kansas overall
– Cases per 100k in last 7 days: 276 (7 cases)
– Population that is fully vaccinated: 32.1% (814 fully vaccinated)
— 36.3% lower vaccination rate than Kansas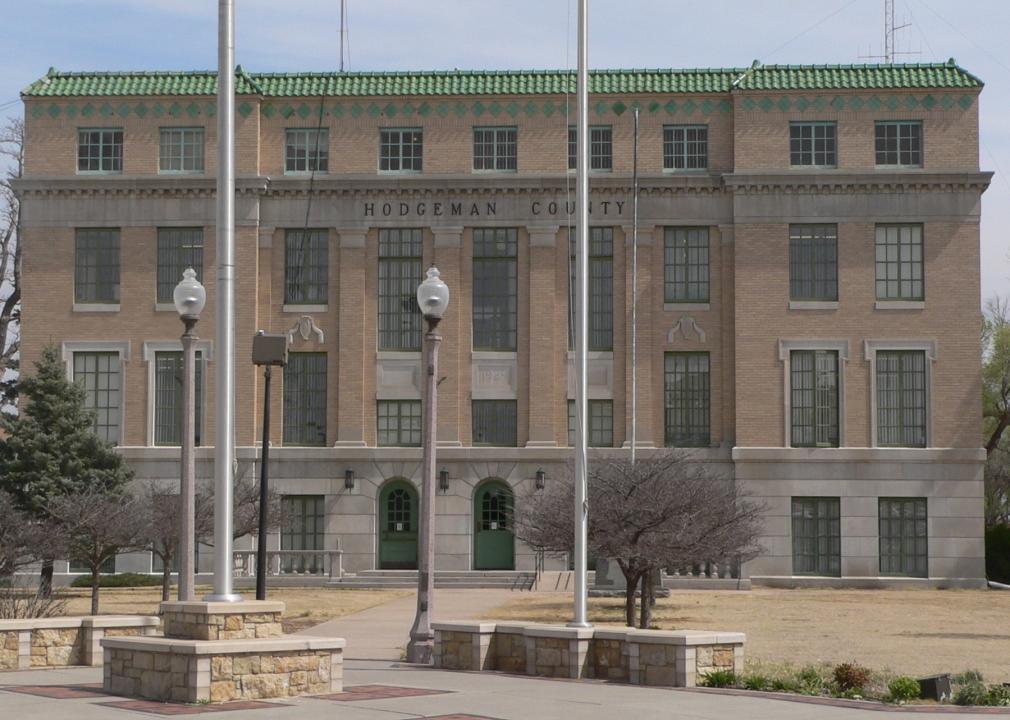
Ammodramus // Wikimedia Commons
#11. Hodgeman County, KS
– Inpatient beds occupied: 83.0% (0.0% by COVID-19 patients)
— 31.7% more full than Kansas overall
– ICU beds occupied: data not available
— 81% full in Kansas overall
– Cases per 100k in last 7 days: 0 (0 cases)
– Population that is fully vaccinated: 40.0% (717 fully vaccinated)
— 20.6% lower vaccination rate than Kansas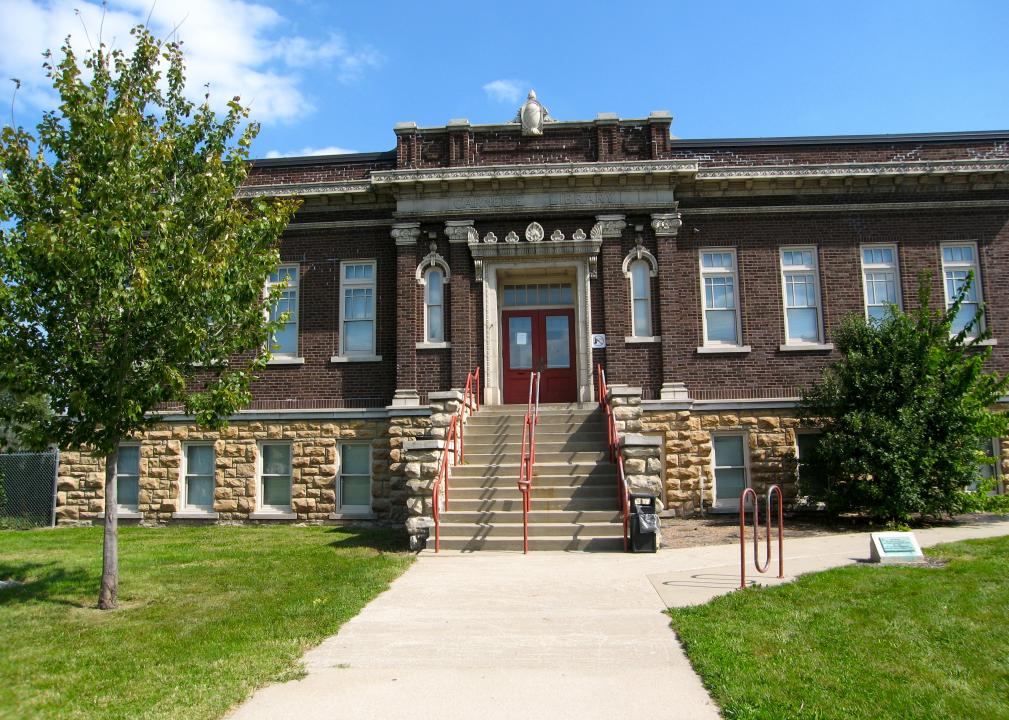
Safire1k // Wikimedia Commons
#10. Wyandotte County, KS
– Inpatient beds occupied: 84.0% (9.0% by COVID-19 patients)
— 33.3% more full than Kansas overall
– ICU beds occupied: 88.0% (26.0% by COVID-19 patients)
— 8.6% more full than Kansas overall
– Cases per 100k in last 7 days: 253 (419 cases)
– Population that is fully vaccinated: 45.5% (75,327 fully vaccinated)
— 9.7% lower vaccination rate than Kansas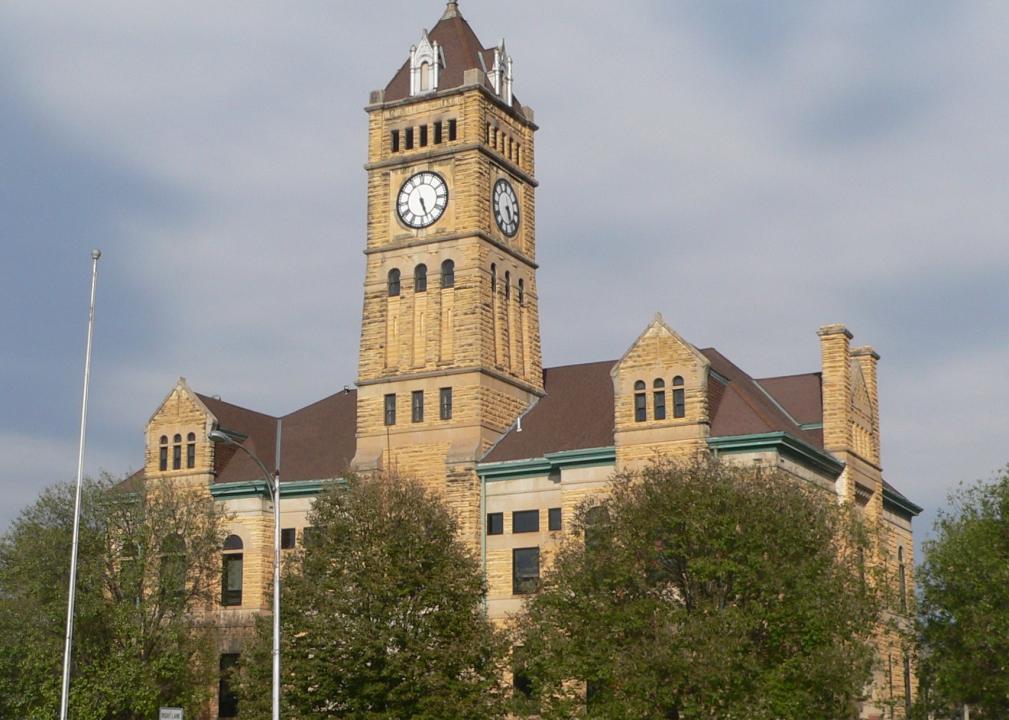
Ammodramus // Wikimedia Commons
#9. Mitchell County, KS
– Inpatient beds occupied: 85.0% (8.0% by COVID-19 patients)
— 34.9% more full than Kansas overall
– ICU beds occupied: 29.0% (7.0% by COVID-19 patients)
— 64.2% more availability than Kansas overall
– Cases per 100k in last 7 days: 602 (36 cases)
– Population that is fully vaccinated: 47.3% (2,827 fully vaccinated)
— 6.2% lower vaccination rate than Kansas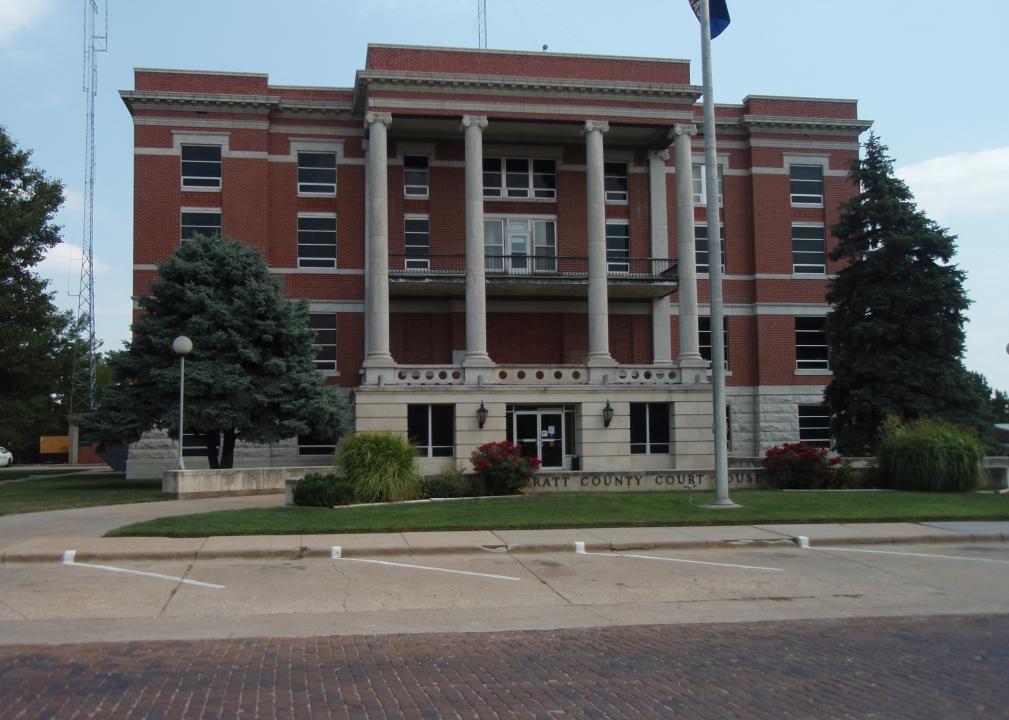
Ichabod // Wikimedia Commons
#8. Pratt County, KS
– Inpatient beds occupied: 86.0% (11.0% by COVID-19 patients)
— 36.5% more full than Kansas overall
– ICU beds occupied: 57.0% (33.0% by COVID-19 patients)
— 29.6% more availability than Kansas overall
– Cases per 100k in last 7 days: 327 (30 cases)
– Population that is fully vaccinated: 41.9% (3,844 fully vaccinated)
— 16.9% lower vaccination rate than Kansas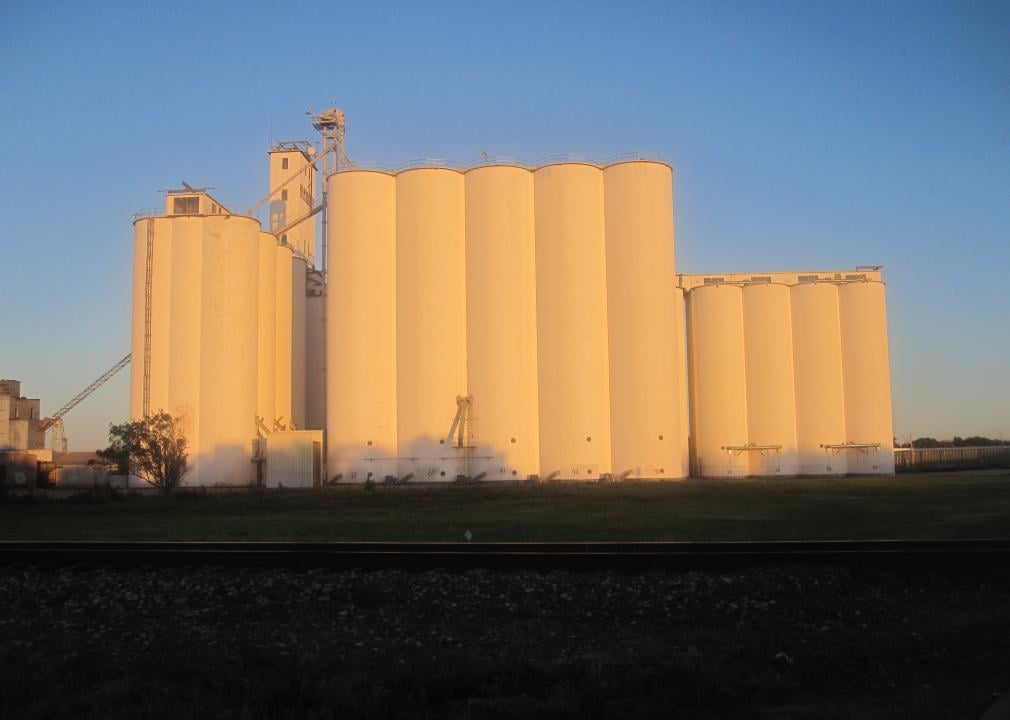
Billy Hathorn // Wikimedia Commons
#7. Seward County, KS
– Inpatient beds occupied: 86.0% (24.0% by COVID-19 patients)
— 36.5% more full than Kansas overall
– ICU beds occupied: 80.0% (59.0% by COVID-19 patients)
— 1.2% more availability than Kansas overall
– Cases per 100k in last 7 days: 373 (80 cases)
– Population that is fully vaccinated: 36.9% (7,900 fully vaccinated)
— 26.8% lower vaccination rate than Kansas
Ron Roberson // Wikimedia Commons
#6. Reno County, KS
– Inpatient beds occupied: 87.0% (18.0% by COVID-19 patients)
— 38.1% more full than Kansas overall
– ICU beds occupied: 81.0% (54.0% by COVID-19 patients)
— 0.0% more availability than Kansas overall
– Cases per 100k in last 7 days: 419 (260 cases)
– Population that is fully vaccinated: 43.2% (26,753 fully vaccinated)
— 14.3% lower vaccination rate than Kansas
National Park Service Midwest Region // Wikimedia Commons
#5. Shawnee County, KS
– Inpatient beds occupied: 88.0% (17.0% by COVID-19 patients)
— 39.7% more full than Kansas overall
– ICU beds occupied: 92.0% (42.0% by COVID-19 patients)
— 13.6% more full than Kansas overall
– Cases per 100k in last 7 days: 327 (579 cases)
– Population that is fully vaccinated: 52.2% (92,391 fully vaccinated)
— 3.6% higher vaccination rate than Kansas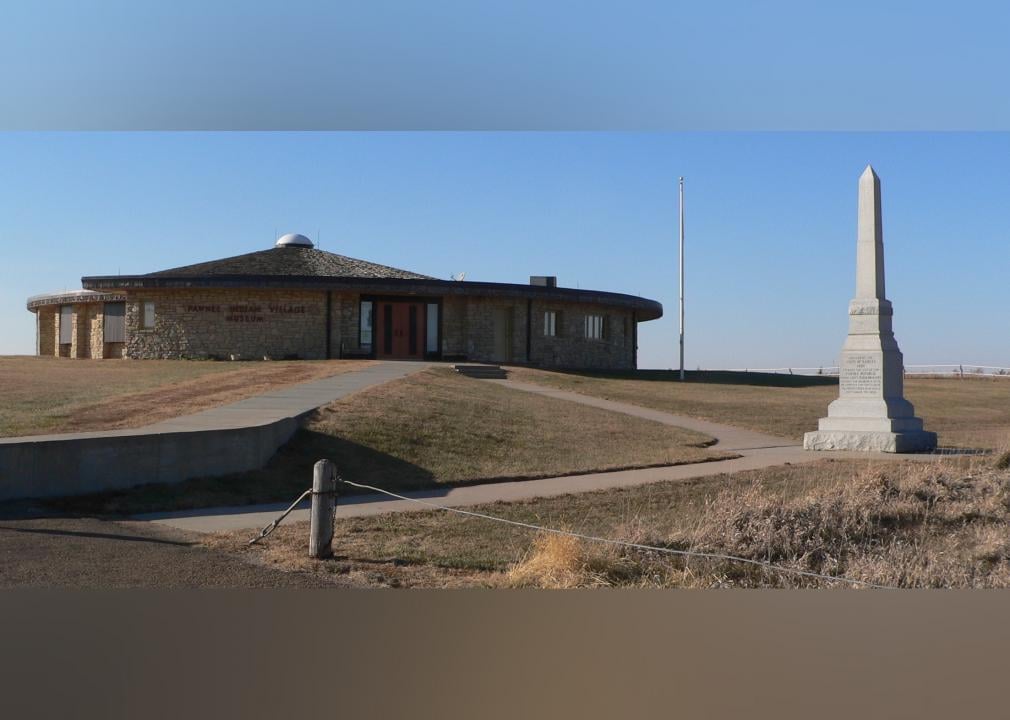
Ammodramus // Wikimedia Commons
#4. Republic County, KS
– Inpatient beds occupied: 91.0% (11.0% by COVID-19 patients)
— 44.4% more full than Kansas overall
– ICU beds occupied: data not available
— 81% full in Kansas overall
– Cases per 100k in last 7 days: 561 (26 cases)
– Population that is fully vaccinated: 44.9% (2,082 fully vaccinated)
— 10.9% lower vaccination rate than Kansas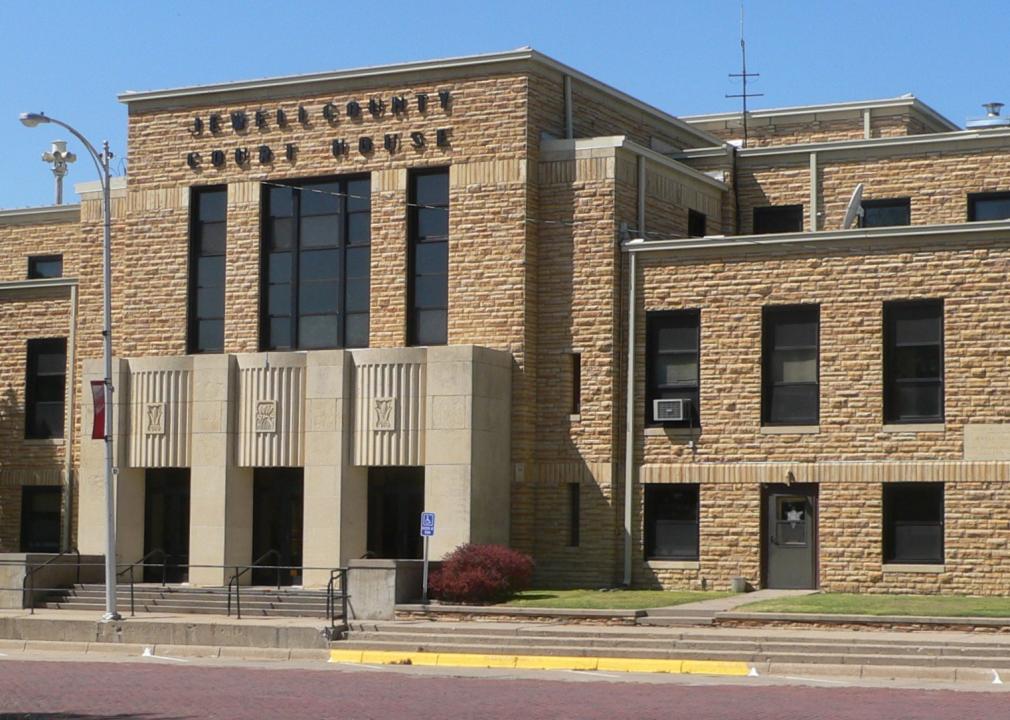
Ammodramus // Wikimedia Commons
#3. Jewell County, KS
– Inpatient beds occupied: 95.0% (0.0% by COVID-19 patients)
— 50.8% more full than Kansas overall
– ICU beds occupied: data not available
— 81% full in Kansas overall
– Cases per 100k in last 7 days: 452 (13 cases)
– Population that is fully vaccinated: 40.2% (1,156 fully vaccinated)
— 20.2% lower vaccination rate than Kansas
Ammodramus // Wikimedia Commons
#2. Ellis County, KS
– Inpatient beds occupied: 98.0% (13.0% by COVID-19 patients)
— 55.6% more full than Kansas overall
– ICU beds occupied: 83.0% (15.0% by COVID-19 patients)
— 2.5% more full than Kansas overall
– Cases per 100k in last 7 days: 228 (65 cases)
– Population that is fully vaccinated: 41.8% (11,922 fully vaccinated)
— 17.1% lower vaccination rate than Kansas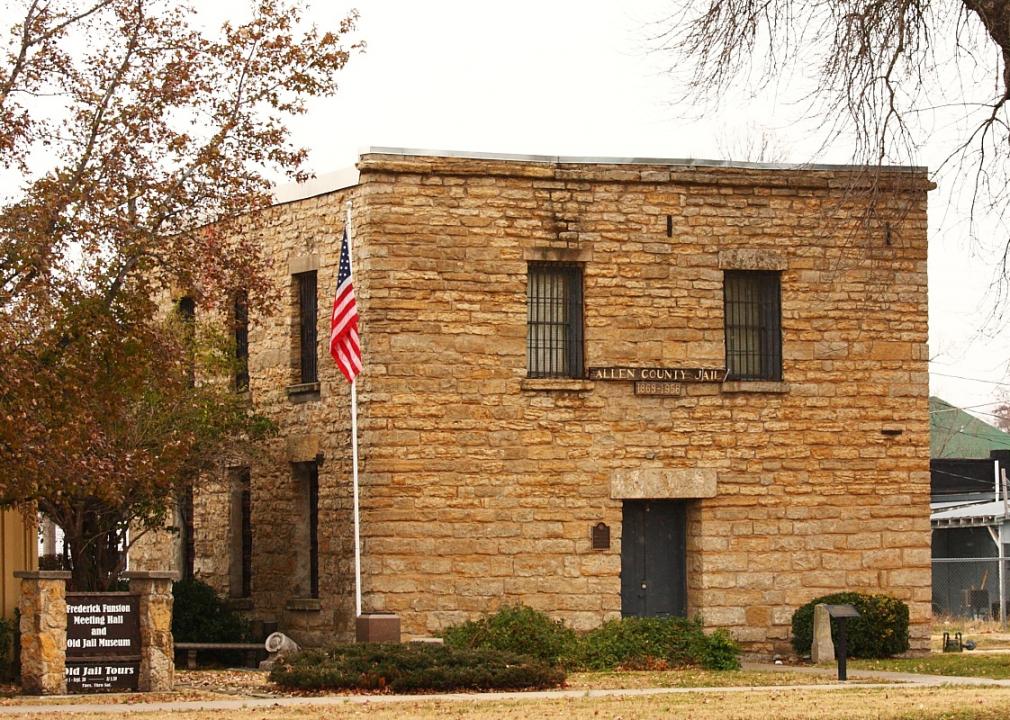
Gordon Huggins // Wikimedia Commons
#1. Allen County, KS
– Inpatient beds occupied: 100.0% (10.0% by COVID-19 patients)
— 58.7% more full than Kansas overall
– ICU beds occupied: data not available
— 81% full in Kansas overall
– Cases per 100k in last 7 days: 404 (50 cases)
– Population that is fully vaccinated: 38.1% (4,715 fully vaccinated)
— 24.4% lower vaccination rate than Kansas


